Get RateX Pro
Published 26 Oct 2025

Signal vs Noise: Who Actually Wins in 2025

Introduction — Why the Market Became Unreadable
In 2025, crypto doesn’t lack data — it drowns in it.
Every second, thousands of transactions, posts, and order-book updates fight for a trader’s attention. But the market has become too fast for human eyes. The signal is buried under an avalanche of noise. What used to be a research problem is now a structural one.
Professional traders spend three to four hours a day switching between dashboards, X (Twitter) feeds, Telegram channels, and private groups — collecting fragments of truth across 5–20 different tabs. Retail users copy what they see online, funds build internal scripts, and yet most still enter after the move, not before it. Meanwhile, closed systems like Binance, BlackRock, or Citadel operate in a different universe.
They don’t “research” — they run data factories that digest their entire market flow in milliseconds. Every order, risk exposure, and sentiment pulse is scored and routed automatically. The rest of the market relies on screenshots and rumors. This gap — between how fast the market moves and how slowly humans can read it — is now measurable.
It costs traders hours, funds millions, and the industry billions in missed alpha. Web3 promised open data; instead, it delivered an open floodgate. What’s missing is not information — it’s a system to make it readable.
Problem #1 — Time Drain & Fragmentation
Every crypto professional talks about alpha, but few admit how much time they waste chasing it.
Across the industry, research has become a full-time job before a single trade is made.
Retail traders spend an average of 11 hours per week scanning X (Twitter) and Telegram threads, reading “alpha drops”, and checking a half-dozen dashboards.
Small funds burn 31 hours a week comparing numbers from 18 sources, while institutional desks still lose over 50 hours to internal validation loops — despite having data engineers and APIs on payroll.
What looks like diligence is actually latency disguised as research.
Each minute spent reconciling dashboards or verifying influencer claims widens the entry gap.
According to multi-source surveys (PwA 2024, Glassnode 2025), the median reaction delay to market-moving news is:
- Retail — 38 minutes
- Small funds — 17 minutes
- Institutional desks — 4 minutes
By the time most participants act, the liquidity break or accumulation phase has already passed.
In dollar terms, that lag translates into a -8.4% annual P&L drag for retail, -3.7% for funds, and -0.9% even for top desks.
The lost edge compounds into tens of billions across the ecosystem each year.
Fragmentation is not a workflow flaw — it’s a hidden transaction cost.
Instead of paying commissions, traders now pay attention: every data tab, API call, and Telegram ping drains bandwidth that could have produced alpha.
Multiply this by millions of participants, and Web3 becomes a global market running at half speed.
Figure 1 — Research Time and Performance Drag (2025)
| Metric | Retail Traders | Small Funds | Institutional Desks |
|---|---|---|---|
| Avg. research time / week | 11.5 h | 31 h | 53 h |
| Unique sources checked | 9 | 18 | 27 |
| Share of “noise” channels | 68 % | 45 % | 22 % |
| Missed entry events / month | 4.2 | 2.1 | 0.7 |
| Annual P&L drag | -8.4 % | -3.7 % | -0.9 % |
(Source: RateXAI Research 2025 based on PwA Crypto Ops Survey, Glassnode Desk Diary, Messari 2024)
Key takeaway
Time has become the most expensive currency in crypto.
Every hour spent collecting scattered data is an hour lost to someone else’s automated signal.
Until decision-makers unify their information flow, alpha will keep decaying — not because markets are smarter, but because humans are slower.
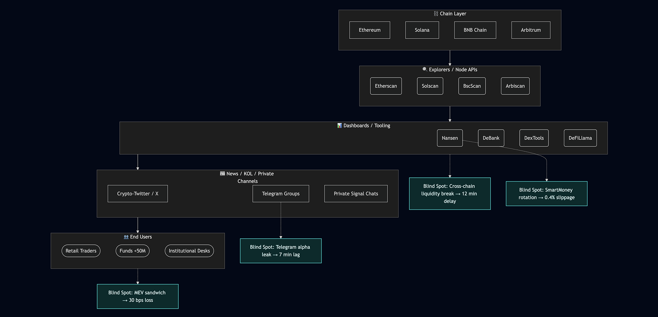
Problem #2 — Fragmented Architecture & Blind Spots
Web3 was meant to be transparent. Instead, it became a patchwork of silos.
Each chain, tool, and data gateway operates like a separate island — complete on its own but disconnected from the rest.
What began as “decentralization” now feels like de-integration.
A trader tracking Ethereum, Solana, and Arbitrum already needs three explorers, two dashboards, and at least one paid API.
When liquidity shifts across chains, visibility collapses.
In real terms, that delay means 10-15 minutes between a SmartMoney rotation and public recognition of it — long enough for the early flow to disappear.
Even professional teams face the same limits.
Premium tools like Nansen, Arkham, or Dune each capture only a vertical slice of the market.
They don’t talk to one another.
Critical signals — MEV extraction, whale accumulation, or cross-chain liquidity breaks — exist in different datasets, priced behind different paywalls, and updated at different intervals.
The result is a landscape full of blind spots:
-
Cross-chain liquidity gaps between ETH, SOL, and ARB that appear 12 minutes late in aggregated dashboards.
-
SmartMoney rotations visible only to Nansen subscribers, adding 0.4% slippage to retail copies.
-
Telegram leaks spreading insider alpha seven minutes before public feeds catch up.
-
Mempool-level MEV attacks costing 30 bps on unprotected trades.
Each fragment alone looks harmless. Together, they form an invisible latency tax that drains capital daily.
Figure 2 — The Fractured Data Stack (2025)
Key takeaway
Crypto doesn’t suffer from a lack of tools — it suffers from tools that don’t talk.
Every layer of separation adds latency, cost, and confusion.
Until data becomes cross-chain, real-time, and verifiable in one flow, traders will keep reacting to ghosts of the market instead of the market itself.
Problem #3 — Noise Dominance & Information Overload
In Web3, data isn’t scarce — attention is.
Every second, crypto markets produce more posts, pings, and price updates than any human can meaningfully read.
The problem isn’t misinformation; it’s oversaturation. The signal is there — buried under noise.
Across X (Twitter), Telegram, and on-chain feeds, the average trader faces over 11.7 million discrete data events per day.
Roughly one-third are “signal”: verifiable transactions, oracle updates, or real order-book movements.
The rest is pure noise — reposts, shill campaigns, copy-paste “alpha” threads, and unverified screenshots.
Even after filtering, most of what reaches a human eye is delayed or distorted:
- 93% of social content carries no verifiable on-chain proof.
- 60% of valid posts appear after the underlying move has already occurred.
- 27% of on-chain alerts are false positives — tiny “dust” transactions or wash trades.
And the average Telegram “tip” gets forwarded to 50+ groups, inflating its credibility without adding truth.
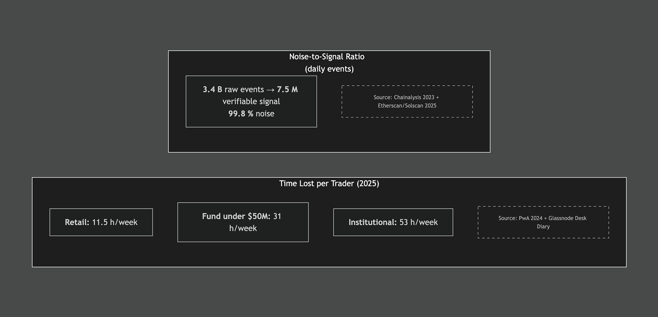
Figure 3 — Web3 Market-Data Noise vs Signal (Daily Events)
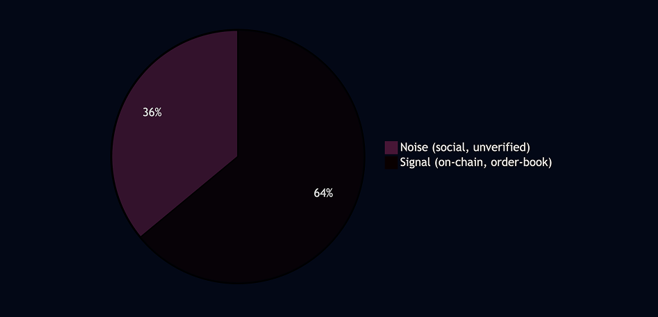
(Data: Chainalysis, Cookie DAO, Etherscan, Solscan, Binance API, Oct-2025)
For a discretionary trader, the effective experience isn’t 36/64 — it’s closer to 9:1 noise-to-signal.
That means out of every ten “insights” they read, only one is grounded in verifiable data.
The rest are attention traps — narratives designed to farm engagement, not profit.
At the institutional level, this imbalance leads to measurable alpha decay.
Reaction windows shorten, models overfit transient sentiment, and dashboards start echoing the same manipulated inputs.
The more data we collect, the less we actually see.
Key takeaway
Web3’s transparency has turned into its own distortion field.
Billions of daily data points, millions of social posts — and yet traders still act blind.
Without machine-level filtering and validation, human analysis operates at 0.000003% of the available data bandwidth.
Problem #4 — The Hidden Financial Cost of Noise
Market noise doesn’t just waste time — it quietly erodes capital.
Every delayed trade, every false signal, every hour spent “catching up” compounds into measurable loss.
According to RateXAI Research (2025), the average trader or fund loses between 1% and 26% of capital annually to noise-related inefficiencies.
The biggest drivers are threefold:
- Entry/exit latency — reacting minutes late to verified moves.
- Misinformation exposure — acting on fake partnerships, rug-pulls, or “ETF approval” rumors.
- Time opportunity cost — hours per week lost to filtering channels instead of executing trades.
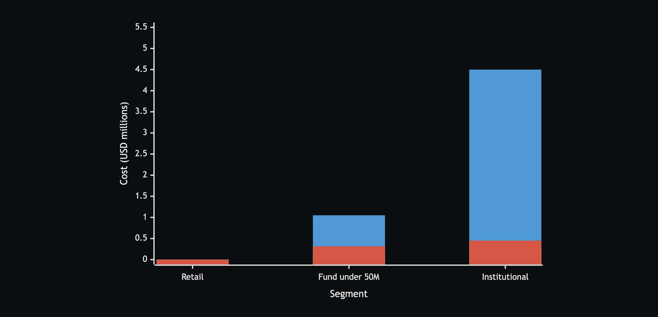
Figure 4 — Annual Cost of Market Noise (USD, 2024-2025)
| Segment | Median Book | Capital Inefficiency | Research-Time Cost | Misinformation Loss | Total Annual Cost | % of Capital |
|---|---|---|---|---|---|---|
| Retail Traders | $25,000 | $2,100 | $3,300 | $1,250 | $6,650 | 26.6 % |
| Small Funds (<$50M) | $35,000,000 | $1,050,000 | $180,000 | $315,000 | $1,545,000 | 4.4 % |
| Institutional Desks | $500,000,000 | $4,500,000 | $265,000 | $450,000 | $5,215,000 | 1.0 % |
(Sources: PwA Crypto Ops Report 2024, Glassnode 2025, Chainalysis Scam Report 2023)
Figure 5 — Line Chart: Annual Cost Breakdown (USD millions)
How the loss adds up:
-
A one-minute delay on BTC or ETH during a 3% intraday move costs ~11 bps in slippage.
-
Retail reaction lag (≈38 minutes) converts that into -8.4% P&L drag per year.
-
Even top desks, with <5-minute latency, still lose around -0.9% annually from fragmented data flow.
-
Across $1B of retail trading notional, this equals $84M in alpha lost each year — an invisible tax paid to inefficiency.
Key takeaway
Noise is not just cognitive friction — it’s a regressive tax.
The smaller the player, the heavier the penalty.
Retail traders lose a quarter of their book trying to “stay informed”, while institutions lose a fraction — not because they’re smarter, but because they’ve automated their filters.
The market doesn’t reward effort; it rewards speed and clarity.
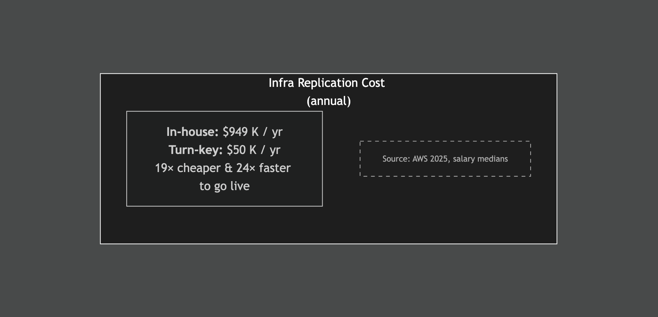
Problem #5 — Infrastructure Debt: The $1M Build Trap
Every serious fund eventually faces the same question: “Should we build our own analytics stack?”
On paper, it sounds smart — full control, private data, internal models.
In reality, it’s a million-dollar detour that rarely delivers alpha.
To replicate even a minimal multi-chain research environment — Ethereum, Solana, and BNB Chain only — a team needs: dedicated nodes, data-lake storage, streaming pipelines, sub-graph indexers, feature stores, GPU infrastructure, and at least five engineers to keep it all alive.
Each of those components burns cash every month before producing a single usable signal.
Figure 6 — Annual Cost & Effort Comparison (2025)
| Cost Component | In-House Build | RateXAI Platform | Notes |
|---|---|---|---|
| Multi-chain nodes (ETH, SOL, BNB) | $78k | $0 | Dedicated + standby nodes |
| Historical data lake (200 TB, 5 yrs) | $42k | $0 | S3 + Glacier |
| Streaming ingest & ETL (Kafka/Flink) | $36k | $0 | Always-on processing |
| Indexing layer (Postgres/ClickHouse) | $55k | $0 | De-normalized data |
| ML feature store + GPU retraining | $48k | $0 | 24/7 SageMaker equivalent |
| Data engineering (2 FTE) | $360k | $0 | Infrastructure only |
| ML / Quant (1 FTE) | $220k | $0 | Feature research |
| DevOps / SRE (0.5 FTE) | $110k | $0 | Failover, uptime |
| RateXAI enterprise plan | $0 | $50k | Unlimited calls, 3 seats |
| Total cash out | $949k / yr | $50k / yr | 19× cheaper |
| Time to first production signal | 9–12 months | 2 weeks | Hiring + audit delay |
| Team head-count | 5.5 FTE | 0.2 FTE | Admin only |
(Sources: AWS 2025 pricing, industry salary medians)
Figure 7 — “Build vs Buy” Architecture Flow
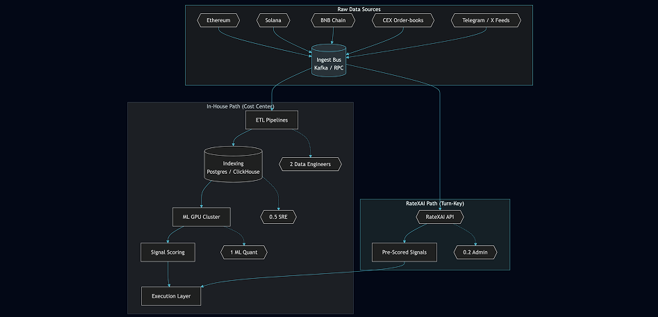
Interpretation
Building in-house feels like ownership but creates infrastructure debt — technical, financial, and temporal.
By the time the internal system reaches parity with institutional latency and uptime, market conditions have already changed.
A $1M annual spend buys nothing that improves decision-speed or accuracy — it just keeps the lights on. Meanwhile, platforms like RateXAI compress the same data pipeline into an API call — turning months of engineering into minutes of output.
That’s not outsourcing; that’s eliminating overhead.
Key takeaway
Infrastructure isn’t alpha.
Spending $1M a year to reinvent a working data stack isn’t “independence” — it’s opportunity loss disguised as innovation.
The real edge lies in analysis, not plumbing.
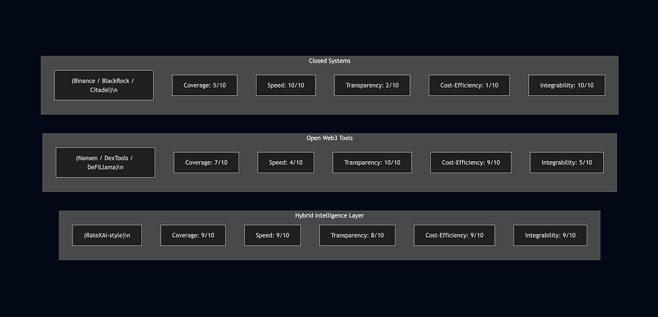
Problem #6 — Closed Systems vs Open Chaos
Two market realities now coexist.
On one side are closed data factories like Binance, BlackRock, and Citadel — sealed ecosystems where every order, risk model, and sentiment stream feeds a single internal brain.
On the other is open Web3 — transparent, permissionless, and completely fragmented.
Closed systems win on speed and precision.
Their matching engines operate in microseconds, their risk models are proprietary, and their data never leaves the firewall.
But they are also opaque — black boxes that retail and most funds will never access.
Open Web3 tools, meanwhile, win on transparency but lose on cohesion.
Dashboards like Nansen, DexTools, or DeFiLlama show valuable slices of on-chain reality, yet they exist in isolation.
A trader moving between them faces seconds-to-minutes of latency — eternity in crypto time.
Between these extremes sits the new class of hybrid intelligence systems — built for real-time, multi-chain analysis with verifiable scoring.
They combine the auditability of Web3 with the execution speed of institutional tech stacks.
RateXAI belongs here: a layer that reads the market like Binance but explains it like Dune.
Figure 8 — Benchmark: Closed vs Open vs Hybrid Intelligence (2025)
| Dimension | Closed Systems (Binance / BlackRock / Citadel) |
Open Web3 Tools (Nansen / DexTools / DeFiLlama) |
RateXAI-Style Hybrid |
|---|---|---|---|
| Data Coverage | Internal order flow + proprietary feeds; no cross-chain visibility | Public on-chain + limited CEX APIs; gaps on OTC, MEV | Unified on-chain + CEX + mempool + social across 30+ chains |
| Speed | Microsecond matching; sub-ms API latency | 3–30 s block lag; 1–60 s refresh | <250 ms end-to-end (ingest → score → alert) |
| Transparency | None; black-box risk weights | Fully open SQL and dashboards | Verifiable scoring logic; hashed feature sets |
| Cost Barrier | $50–100 M build; $20 M/yr upkeep | Freemium → $3–12 K/yr | $50 K/yr SaaS; no infra spend |
| Integration Depth | Full internal execution stack | Read-only dashboards | Direct routing via REST / WebSocket / FIX |
Figure 9 — Decision-Readiness Radar (Score 0-10)
(Scores based on operational latency, coverage depth, and verifiability — RateXAI Research 2025)
Interpretation
Closed systems dominate because they see everything — but only inside their walls.
Open systems show everything — but too slowly and too separately.
Hybrid systems are the bridge: real-time, verifiable, and composable.
They deliver the speed of Binance with the audit trail of Web3 — something neither side can achieve alone.
Key takeaway
The future isn’t fully open or fully closed — it’s selectively transparent.
Intelligence must move at machine speed and remain verifiable.
That’s the only path where traders, funds, and protocols compete on insight — not on access.
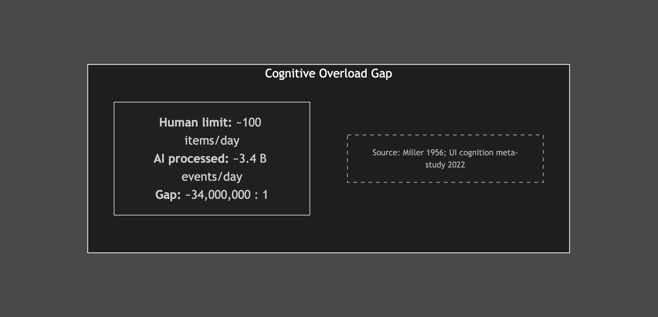
Problem #7 — Human Bandwidth Collapse
Even with perfect data, humans can’t keep up.
Cognitive limits, not market opacity, have become the final bottleneck in Web3 decision-making.
The average trader’s brain can handle around 100 meaningful data points per day before accuracy collapses.
The market now produces over 3.4 billion discrete events every 24 hours — a ratio of 34 million : 1 between what exists and what a human can process.
This gap explains why traders “feel informed” yet still act late.
They are not underinformed — they are overstimulated.
The constant stream of Telegram alerts, price notifications, influencer tweets, and bot updates overwhelms short-term memory and pattern recognition.
What was once a data advantage has turned into attention debt.
AI-driven systems, by contrast, thrive in that environment.
They don’t read — they parse.
They compress billions of events into a few dozen ranked outputs — signals, not sentences.
That compression layer is now the dividing line between staying ahead of the market and drowning in it.
Figure 10 — Daily Information Firehose vs Human Attention
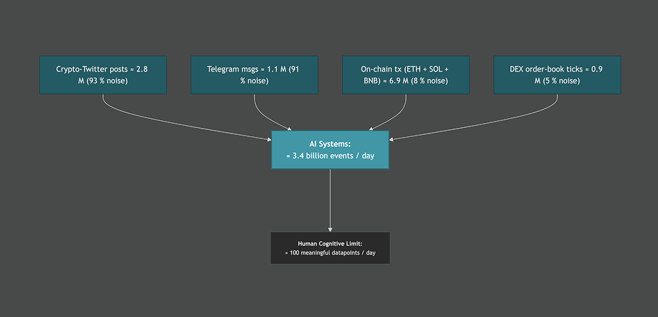
(Data: RateXAI Research 2025 — based on Chainalysis, Binance API, Etherscan/Solscan)
Table — Reality Behind the Bars
| Stream | Daily Count (Oct 2025) | Noise Filter | After Filter ≈ Signal |
|---|---|---|---|
| Crypto-Twitter posts | 2.8 M | 93 % noise | 0.20 M |
| Telegram messages | 1.1 M | 91 % noise | 0.10 M |
| On-chain transactions (ETH+SOL+BNB) | 6.9 M | 8 % noise | 6.3 M |
| CEX order-book ticks | 0.9 M | 5 % noise | 0.85 M |
| Total machine-readable events | ≈ 11.7 M | — | ≈ 7.5 M |
| Raw firehose (incl. duplicates, retweets) | ≈ 3.4 B | 99.7 % redundant | ≈ 7.5 M |
Interpretation
Human cognition hasn’t evolved for billion-event markets.
Traders process 0.000003% of available data, meaning their strategies rely on partial visibility and narrative bias.
AI systems reverse that ratio — compressing terabytes into verified, ranked insights within human bandwidth.
The “edge” in 2025 isn’t who sees more, but who filters better.
Key takeaway
The Web3 data explosion has outgrown human perception.
Without automated compression, decision-makers operate blind — flooded by numbers they can’t meaningfully absorb.
Intelligence now means reduction: cutting 3.4 billion events down to fifty actionable signals per day.
Executive Summary — The True Cost of Noise
By 2025, noise has become Web3’s invisible tax.
It steals time, fragments data, distorts signals, inflates infrastructure costs, and overwhelms human cognition.
Across traders, funds, and institutions, its impact is measurable — in hours, in dollars, and in lost opportunities.
The evidence speaks for itself:
-
600 hours per year lost by retail traders to manual data filtering — worth $3.3K in time alone.
-
99.8% of all daily crypto data is noise. Only 7.5M out of 3.4B events are verifiable signals.
-
Building institutional-grade analytics internally costs $949K per year and 12 months of work — versus $50K and two weeks using RateXAI.
-
The cognitive overload gap stands at 34,000,000 : 1 — humans can consciously process only 100 items a day.
This is the real cost of noise:
- Lost alpha.
- Slower decisions.
- Fragmented visibility.
- Capital burned on infrastructure that doesn’t trade, just stores.
Figure 11 — RateXAI “Cost of Noise” Executive Dashboard
Interpretation
Noise doesn’t just distract — it compounds.
Each layer of inefficiency adds friction: fragmented architecture, delayed reactions, duplicated work, wasted talent.
Together, these form a systemic performance drag across Web3.
The solution isn’t another dashboard — it’s intelligence that filters, verifies, and ranks signals before they reach the screen.
RateXAI’s architecture exists for that exact purpose:
to turn raw data → verifiable signals → executable action, all within milliseconds and without building an internal data team.
Final takeaway
Noise is the market’s new inflation.
You can’t see it, but you pay for it every day — in hours, in dollars, in missed trades.
The only real hedge is automation that restores clarity, credibility, and speed.
RateXAI doesn’t promise silence; it promises signal.

 06 Jun 2024