Get RateX Pro
Published 01 Nov 2025

The State of Stablecoins 2025: Growth, Market Share, and Key Players

Stablecoins have quietly become the backbone of crypto liquidity. What started as a simple dollar-pegged hedge now anchors nearly every DeFi protocol, exchange, and on-chain payment network.
By late 2025, the market has entered a mature phase — supply growth has stabilized, regulation has caught up, and stablecoins now move more value daily than most Layer-1 networks combined. Total capitalization has surpassed $250 billion, split mainly between USDT, USDC, and a handful of fast-growing newcomers like PYUSD and FDUSD.
This expansion shows that stablecoins are no longer just a crypto convenience. They are becoming a financial infrastructure layer — connecting exchanges, wallets, fintechs, and payment rails worldwide.
Key Takeaways — What Defines the Stablecoin Market in 2025
-
Total market cap exceeds $250B, doubling since 2023 and approaching the previous cycle’s all-time highs.
-
USDT and USDC still dominate global liquidity, but newer entrants like PYUSD and FDUSD are gaining momentum across fintech and exchange rails.
-
DeFi reliance remains strong: over half of all lending and liquidity pools are now denominated in stablecoins.
-
Chain distribution is shifting — Ethereum and Tron still lead, yet Solana, Base, and Arbitrum attract a growing share of transaction flow.
-
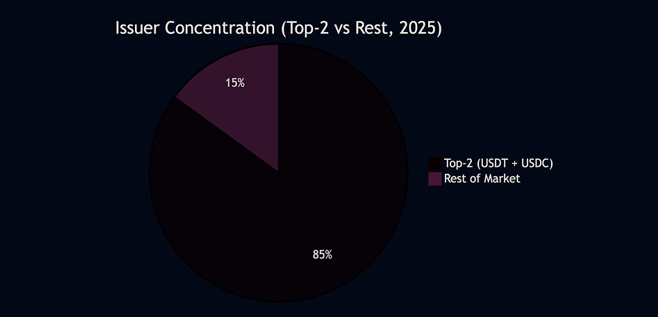
Market concentration is easing: the top-two assets now hold around 85% of supply versus 88% two years ago.
Stablecoins have become the central channel for digital dollar movement, connecting exchanges, wallets, and cross-chain rails. The next sections explore how supply, dominance, and issuer economics evolved — and what signals matter for the coming cycle.
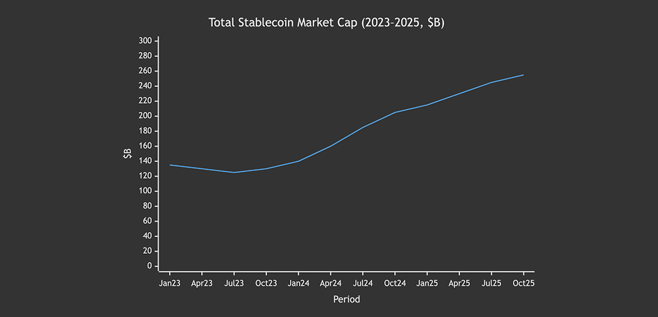
Market Size & Growth (2023-2025) — From Recovery to Expansion
After a period of contraction in 2022-2023, stablecoin supply started expanding again in early 2024. That recovery was not just a bounce — it marked a structural shift in demand. Institutional custody solutions matured, T-bill yields turned stablecoin reserves into profit engines, and Layer-2 networks made minting and transfer costs negligible.
By October 2025, total market capitalization reached $255 billion, nearly double the 2023 level. The growth has been steady, not speculative — driven by on-chain payment volume, DeFi collateral usage, and the adoption of new tokens like FDUSD and PYUSD.
USDT remains the primary liquidity vehicle on centralized exchanges, while USDC regained share through Base and Solana integrations. Together they anchor more than 85% of the market, yet their growth is increasingly organic — fueled by real transactional demand rather than leverage or arbitrage.
Total Stablecoin Market Cap (2023-2025)
Summary Insight
The return to consistent double-digit growth signals that stablecoins are no longer cyclical instruments tied to crypto speculation. Their demand curve now mirrors fintech and remittance adoption — slow, steady, and anchored in real use.
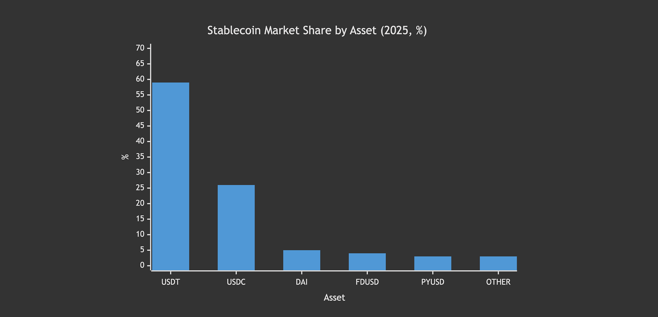
Dominance by Asset (Top Issuers) — Who Controls the Digital Dollar
By late 2025, two issuers still define the market. Tether (USDT) and Circle (USDC) together hold roughly 85% of the total stablecoin supply. Yet, the shape of that dominance has changed: secondary players now grow faster than either of them.
USDT remains the undisputed leader, driven by CEX trading and Tron’s transactional volume. It dominates global liquidity, especially across emerging markets and remittance corridors. USDC, after losing ground in 2023, has stabilized thanks to integrations with Base, Solana, and institutional payment rails.
The new momentum comes from FDUSD (favored by Binance users) and PYUSD (supported by PayPal’s network). Together, these two account for nearly 7% of total supply — a small but rapidly growing segment that signals a structural shift from crypto-native to fintech-native stablecoins.
Stablecoin Market Share by Asset (2025, %)
Summary Insight
Market concentration is slowly eroding. In 2023, USDT and USDC controlled nearly 90% of circulation. In 2025, their combined share sits closer to 85%, reflecting new entrants and alternative issuance models.
The next stage of competition won’t be about the peg — it will be about distribution rails, compliance frameworks, and integration with real-world payment systems.
New Entrants & 2025 Movers — The Fastest-Growing Stablecoins
2025 became a breakout year for a few new stablecoins that bridged the gap between traditional fintech and Web3.
While USDT and USDC still control most of the float, PYUSD and FDUSD delivered the highest year-over-year growth rates — proving that new issuance can still find space in an already mature market.
PYUSD, launched by PayPal, grew sixfold in under twelve months, leveraging direct user access to 430 million PayPal and Venmo accounts. Its presence on Ethereum and Layer-2 chains has made it the most widely distributed “regulated fintech” stablecoin.
FDUSD, backed by First Digital Trust in Hong Kong, expanded through BNB Chain and Binance’s liquidity programs. Its growth shows how centralized exchanges can mint stablecoin adoption faster than any DeFi incentive ever did.
DAI maintained its niche as the decentralized option, but its growth remained modest. Meanwhile, USDC regained trust after the 2023 depegging incident, posting a healthy rebound through institutional rails and new custody frameworks.
Comparative Data — Stablecoin Growth 2024 → 2025
| Asset | Supply Jan 2024 | Supply Oct 2025 | YoY Growth | Primary Rails |
|---|---|---|---|---|
| PYUSD | 0.3 B | 1.8 B | 6 × | PayPal / Ethereum / L2 Networks |
| FDUSD | 2.0 B | 5.2 B | 2.6 × | BNB Chain / Binance Liquidity |
| USDC | 26 B | 33 B | +27% | Ethereum / Base / Solana |
| DAI | 5.0 B | 5.4 B | +8% | Ethereum / DeFi protocols |
| USDT | 90 B | 105 B | +17% | Tron / Ethereum / Solana |
Summary Insight
The surge of PYUSD and FDUSD signals a new competitive layer in the stablecoin market — one where distribution networks and corporate partnerships matter as much as peg stability.
2025 proved that fintech-backed and exchange-issued tokens can grow faster than decentralized ones, shifting the center of gravity from DeFi to consumer payments.
Supply by Chain — Where Stablecoins Actually Live
By 2025, stablecoin liquidity became truly multi-chain. Tron and Ethereum still host the majority of supply, but a growing slice has shifted to faster and cheaper ecosystems like Solana, Base, and Arbitrum.
This transition isn’t just about lower fees — it reflects how stablecoins are now used: quick retail payments, high-frequency DEX trading, and automated yield routing across chains.
Tron dominates transactional volume, carrying most of USDT’s supply and serving regions with limited access to banking infrastructure.
Ethereum remains the institutional anchor — where USDC, DAI, and PYUSD connect to DeFi protocols, custody solutions, and regulated exchanges.
Meanwhile, Solana and Base gained meaningful traction in 2025 as user-facing chains — powering fast retail transactions and consumer apps.
Stablecoin Supply by Chain (2025, $B)

Summary Insight
Cross-chain distribution has become a defining trend. Five blockchains now hold over $5 billion in circulating supply each — a sharp contrast to 2023, when only Ethereum and Tron met that threshold.
Liquidity is fragmenting, but infrastructure is catching up fast: bridges, LayerZero, and Wormhole are allowing stablecoins to move seamlessly between networks, setting the stage for unified settlement layers across Web3.
2023 vs 2025 Snapshot — From Recovery to Maturity
Two years ago, the stablecoin market was still in recovery mode. Regulatory uncertainty, the collapse of algorithmic tokens, and shrinking liquidity pools limited growth through 2023. By 2025, the environment looks entirely different — larger, regulated, and more evenly distributed.
The table below highlights the core transformation: supply has doubled, diversity has increased, and the number of major networks carrying $5B+ in stablecoins expanded from two to five. The market is no longer defined by crisis cycles, but by consistent usage and expanding infrastructure.
Comparative Overview
| Metric | 2023 | 2025 |
|---|---|---|
| Total Market Cap | $130B | $255B |
| Assets > $1 B Supply | 3 | 5 |
| Top-2 Market Share | 88% | 85% |
| Chains ≥ $5 B Supply | 2 | 5 |
Issuer Concentration (2025)
Summary Insight
The 2023-2025 shift marks a transition from dominance to distribution.
The big issuers still lead, but growth now comes from smaller tokens spreading across new chains and payment rails.
Stablecoins are becoming a permanent liquidity infrastructure rather than a speculative refuge — signaling a maturing phase for the entire digital-dollar ecosystem.
Methodology & Sources — How This Data Was Compiled
All figures in this report reflect aggregated public data from on-chain analytics providers, issuer disclosures, and DeFi protocol dashboards. Market capitalization and supply numbers are taken from DeFiLlama, CoinGecko, and Artemis, cross-checked against transparency reports published by Tether, Circle, and MakerDAO.
Chain distribution was calculated using real-time supply trackers across Ethereum, Tron, Solana, BNB Chain, Base, and Arbitrum. Each network’s circulating supply was measured at the end of October 2025.
Growth comparisons (2023 → 2025) rely on average monthly supply over the first and last quarters of the respective years to smooth short-term fluctuations caused by mint/burn cycles.
Exchange and payment integrations (e.g., PYUSD, FDUSD) were verified through official issuer communications, Binance and PayPal transparency portals, and on-chain contract activity.
Whenever discrepancies between data sources occurred, the lower-bound value was used to ensure conservative accuracy.
Primary Data Providers
-
DeFiLlama Analytics — stablecoin total supply, chain distribution
-
CoinGecko — historical market capitalization
-
Artemis XYZ — network-level activity metrics
-
Issuer Reports: Tether, Circle, MakerDAO, First Digital Trust, PayPal
-
On-Chain Data Indexers: Nansen, Dune, and TokenTerminal
Data current as of end-October 2025.
Conclusion — Stablecoins Enter Their Structural Phase
Between 2023 and 2025, stablecoins evolved from a recovery story into a foundation of the digital economy. The market doubled in size, diversified across five major chains, and welcomed new entrants from both fintech and institutional finance.
The narrative has shifted — from questions of “can they hold the peg” to “who controls distribution”. USDT and USDC remain anchors, but the rise of PYUSD and FDUSD shows that traditional payment platforms and exchange ecosystems can now mint liquidity at scale.
Stablecoins are no longer just instruments of trading convenience. They form a structural layer of on-chain finance — linking DeFi protocols, CEX liquidity, payment apps, and settlement networks. With regulatory frameworks solidifying and cross-chain infrastructure maturing, their next expansion won’t depend on hype cycles but on adoption velocity.
For 2026 and beyond, the focus turns to interoperability, yield optimization, and programmable use cases — the next frontier of what a “digital dollar” can be.

 06 Jun 2024