Get RateX Pro
Published 24 Jun 2025

Understanding the Scoring Model: How Crypto Quality Is Measured

Why Scores Are Important
Speculation and wild price swings dominate the crypto world. Solid tools to evaluate crypto projects are hard to find. Hype-driven metrics, reputation systems, or price trends scratch the surface. To make smart investments or vet listings, you need deeper insights.
Our scoring system focuses on one key question: How can you fairly measure the quality of a crypto project? This article explains how we break it down.
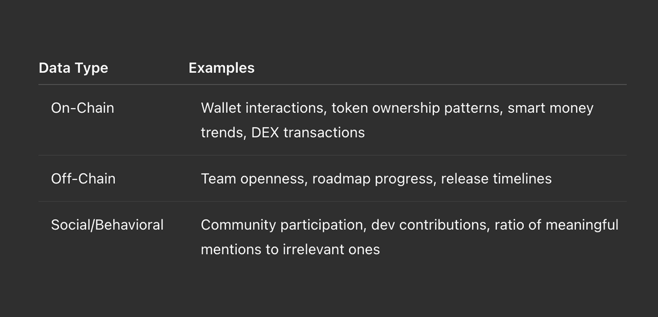
Data Sources: What We Look At
The model pulls data from a combination of on-chain factors, off-chain information, and social interactions. Here's how each piece plays its part:
Data Types and Examples
The team organizes, refines, and confirms each dataset before feeding it into the system.
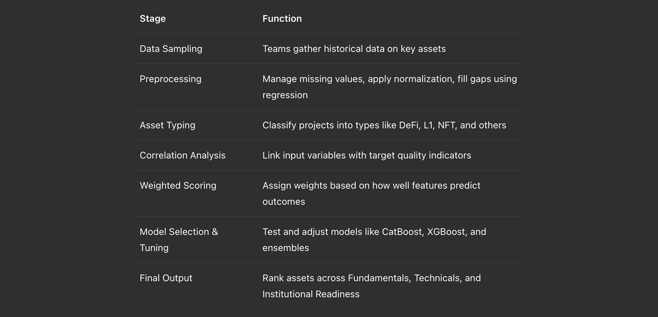
How the Scoring Pipeline Works
The system uses machine learning and data analysis to transform raw inputs into ranked quality scores. Here’s a simple breakdown of the process:
Scoring Pipeline Overview
Machine Learning Models in Use
Our team trains several regression models using historical data and predictive signals. Examples include those tuned to offer reliable results across multiple scenarios:
- XGBoost Regressor: Handles high-dimensional and sparse data very well.
- CatBoost Regressor: Works great with categorical data and needs little tweaking.
- Neural Net Regression: Used to fill in missing gaps and fine-tune for sensitivity.
At each step, cross-validation and k-fold testing help avoid overfitting and make results dependable.
What We Evaluate and Why
We break down scores into three main areas:
Evaluation Dimensions
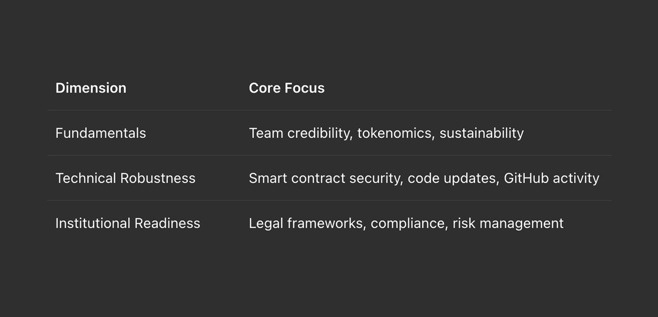
Each sub-score is shown and plays a role in building the overall composite rating.
Understanding the Score
The scores fall between 0 and 100. To make them easier to read, they are split into quartiles:
-
80–100: Solid high-quality projects worth investing in or listing.
-
60–79: Decent quality with both strengths and weaknesses.
-
40–59: Weak or shaky foundations that need proving.
-
0–39: Risky, unreliable assets with low trust.
The score does not stay the same. It updates every week based on fresh data and changes in activity.
Practical Use
People and organizations rely on RateX scoring to make informed decisions:
-
Digital asset funds conduct due diligence
-
Exchanges review tokens before listing
-
Researchers study protocol development
-
Projects compare themselves to market standards
Conclusion
The crypto space needs improved metrics. RateX Scoring shifts the focus from hype-filled choices to decisions based on measurable quality. It relies on data. It works with models. It is meant to serve institutions.
Visit this page to explore the full scoring dashboard and access detailed project insights.
Start making decisions backed by real data.
Read More

 06 Jun 2024