
 Get RateX Pro
Inside RateX Score: How We Assess Crypto Assets

 11 Feb 2025
RateXAI provides the most recent updates on a wide range of crypto market data.
Every minute, we query various exchanges to gather the most recent information through APIs. Once collected, the data is processed through our advanced algorithms to ensure accuracy and integrity by running it through thorough cleaning and verification steps.
We offer a comprehensive selection of metrics across numerous crypto assets, all subjected to rigorous validation processes.
In this article, we dive into the methodology behind RateX Score — our aggregate rating system designed to capture multiple facets of a crypto asset’s overall standing and behavior within the market.
RateX Score
As highlighted above, RateX Score is a comprehensive rating system that evaluates multiple aspects of a crypto asset’s market position and overall performance.
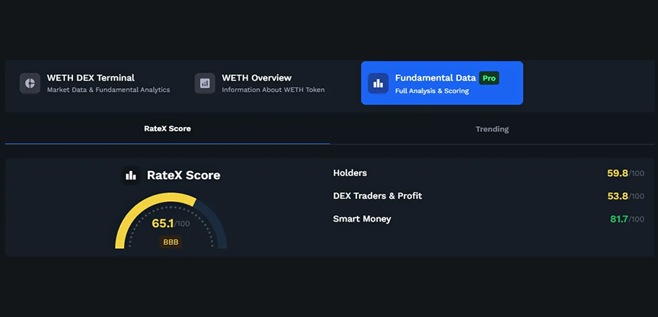
Each token has its own RateX Score, evaluated based on 3 different categories listed below. A numerical score (0 to 100) that evaluates a token's performance:
Holders
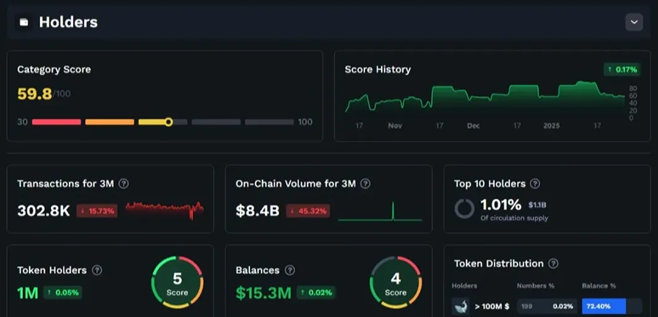
This metric tracks the number of unique wallet addresses currently holding the asset for over 30 days. It is calculated based on blockchain data to count active wallets and can be used to measure the asset’s distribution and popularity among retail and institutional investors.
Holders Definition
"Holders" refers to addresses that have any amount of tokens greater than the minimum threshold, which in this case means any positive balance.
Activity Widgets
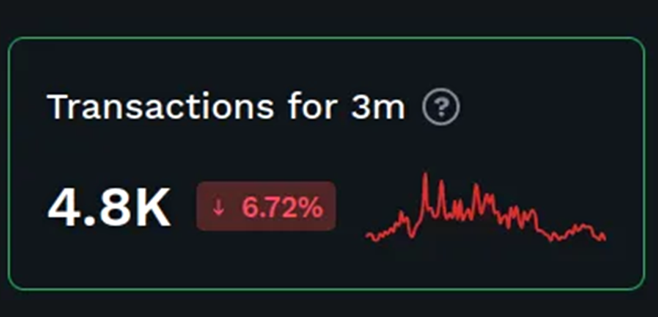
Transactions for 3 Months
This widget tracks the number of transactions for the token on the current day and shows a graph of changes in the number of transactions over the last three months. The percentage change is calculated by comparing the current day’s number of transactions to the number from three months ago.
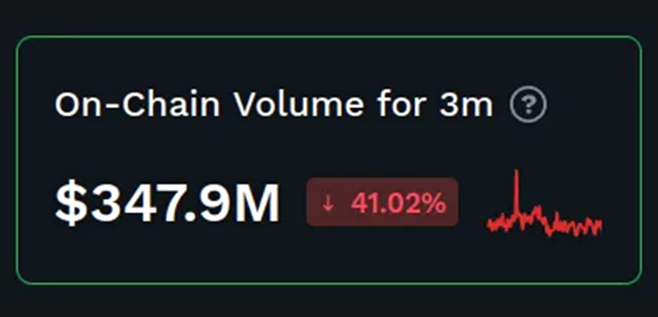
On-Chain Volume for 3 Months
This widget displays the total volume of transactions and swaps for the token. It shows the changes in total transaction volume over the last three months, with the percentage change calculated between the current day’s value and the value from three months ago.
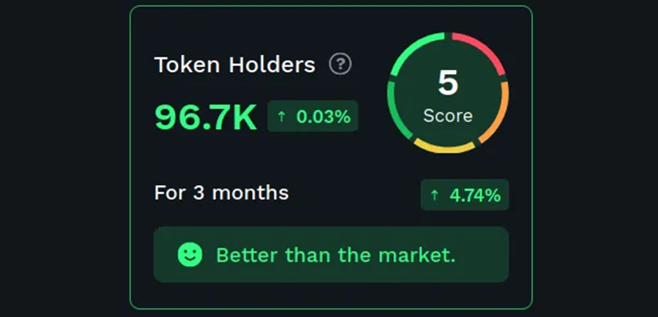
Token Holders
Shows the total number of token holders at the current time, along with the percentage change in the last 24 hours and over the past three months, also its performance comparison with the other tokens in the same category.
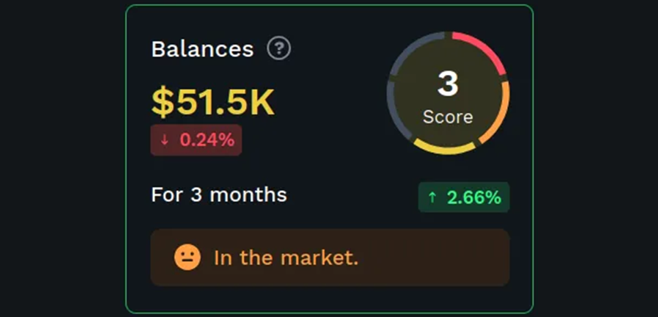
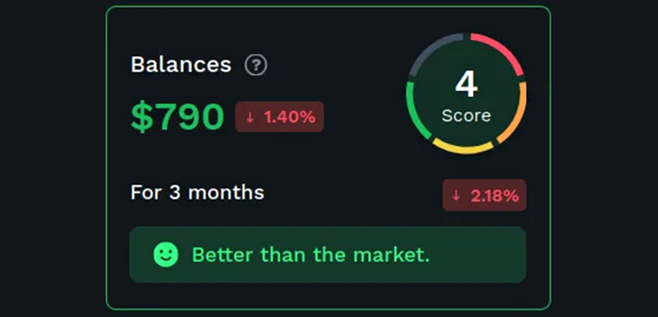
Balances
Displays the total balance of token holders, i.e., the total sum of all balances at the current time, along with the percentage change in the last 24 hours and over the last three months, also its performance comparison with the other tokens in the same category.
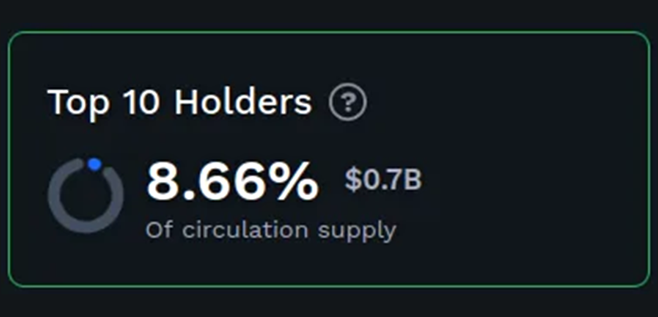
Top 10 Holders
This widget shows the share of the circulating supply held by the top 10 holders. The value is based only on active addresses (those that have sold or bought tokens) within the same period used to calculate the circulating supply.
PNL (Profit and Loss)
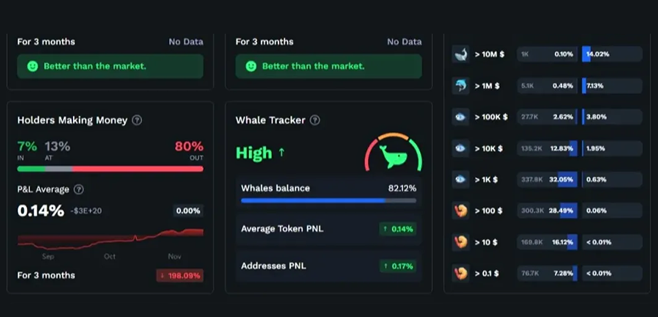
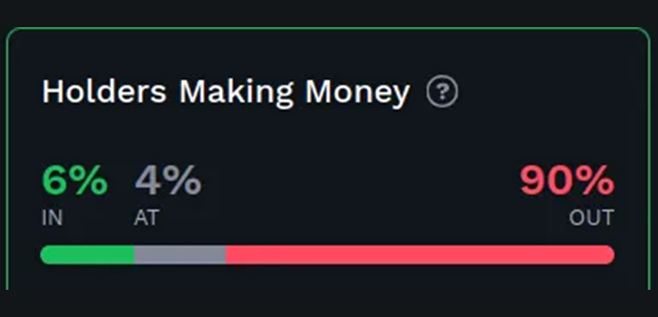
Holders Making Money
This widget categorizes holders based on whether they are making a profit or a loss:
- In Money (Green) – Holders who are currently in profit.
- At Money (Gray) – Holders who are breaking even.
- Out of Money (Red) – Holders who are in loss.
The "Holders Making Money" widget tracks both open positions and closed (liquidated) positions over the past three months. It calculates the profit and loss (PNL) for each trade by measuring the percentage price change between the buy and sell prices for both open and closed positions. Based on this PNL calculation, the widget categorizes holders as:
-
Out of Money (loss): If the PNL is negative (<0), the holder is losing money, and they are placed in the "Out" category.
-
At Money (break-even): If the PNL is positive (or =0) but below a certain threshold (break-even level), the holder is considered to be breaking even. This threshold accounts for the transaction fees incurred, meaning the token price must rise by a certain percentage just to cover these fees.
-
In Money (profit): If the PNL exceeds the break-even level, the holder is making a profit.
In summary, holders are divided into three categories based on their PNL from token transactions in the last three months:
- Profit (In Money): PNL greater than the break-even threshold.
- Break-even (At Money): PNL positive but less than the break-even threshold.
- Loss (Out of Money): PNL negative.
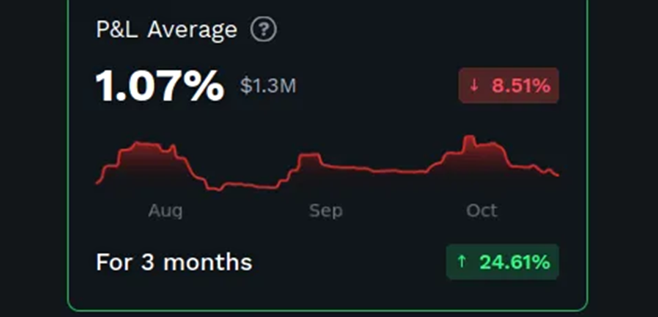
P&L Average
Displays the average profit or loss of token holders. This widget shows a weighted average PNL based on closed positions at the current time, as well as the total P&L in dollar value. It also shows percentage changes over the last 24 hours and three months.
The widget also includes a graph that shows the P&L of token holders based on liquidated (closed) positions over the last three months. To calculate the average PNL, the widget considers each trade's buying and selling price to determine the PNL for every closed position. From there, it calculates the weighted average PNL based on these individual PNL values.
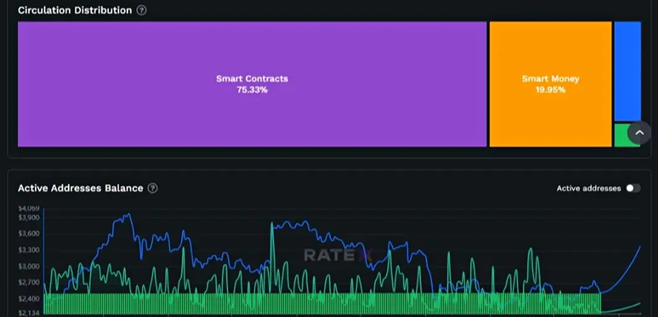
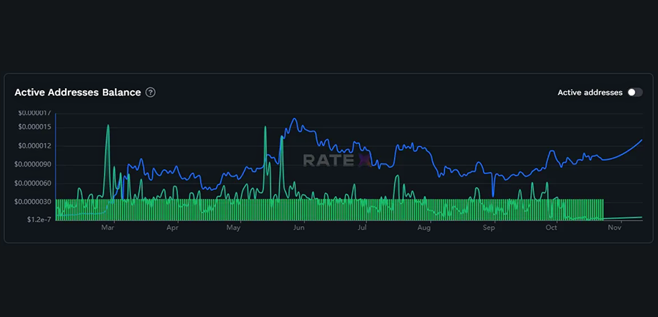
Active Addresses Balances
This widget displays the balances and profit/loss (P&L) of token holders over time. It tracks the token price alongside these balances and highlights the balances of wallets that made a profit (classified as In Money) on any given day.
Widgets Tracker
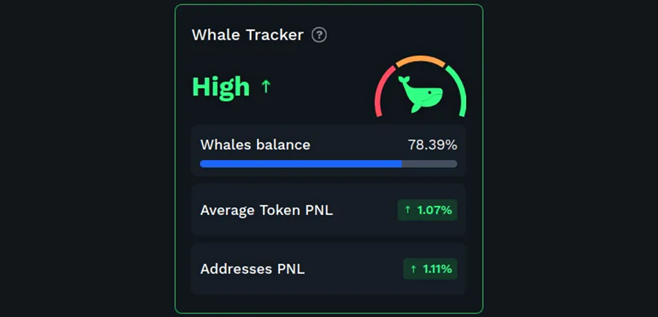
Holders_Whale Tracker
This widget tracks whales — addresses holding more than $500,000 worth of tokens. It shows the share of whales in the total balance held by all token holders, categorizing their dominance as:
- Low: Whale share is less than 30%
- Medium: Whale share is between 30% and 60%
- High: Whale share is greater than 60%
Additionally, the widget provides:
-
Average Token PNL: The overall weighted average profit and loss (PNL) of all token holders based on their closed positions.
-
Addresses PNL: The weighted average PNL of whale addresses specifically.
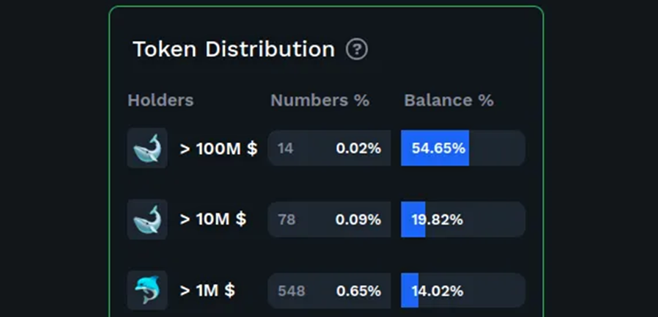
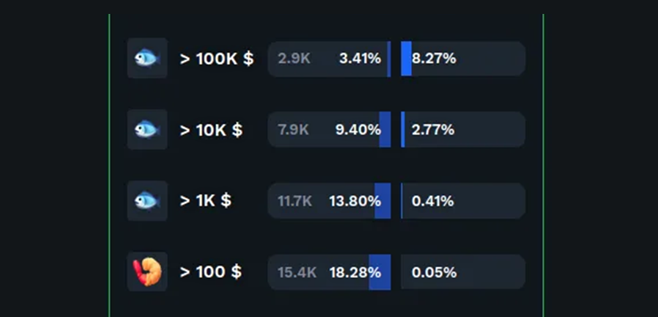
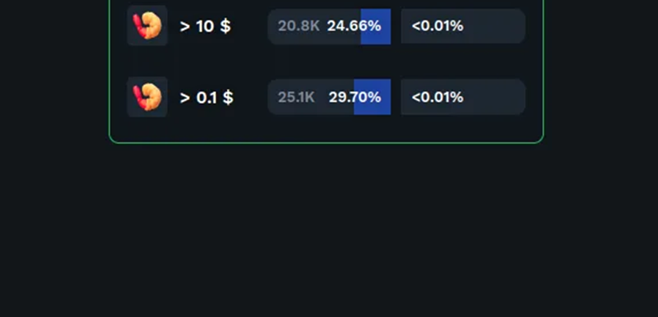
Token Distribution
This widget categorizes token holders based on the balance in their wallets. It shows the distribution of holders by wallet balance and their share in the total token supply.
-
Number (%): The percentage of holders in each balance category.
-
Balances (%): The percentage of the total token supply held by each category of holders.
For example:
- Wallets holding more than $100M: There are 14 holders with balances over $100 million, representing 0.02% of all token holders. These holders control 54.65% of the total tokens held by all holders.
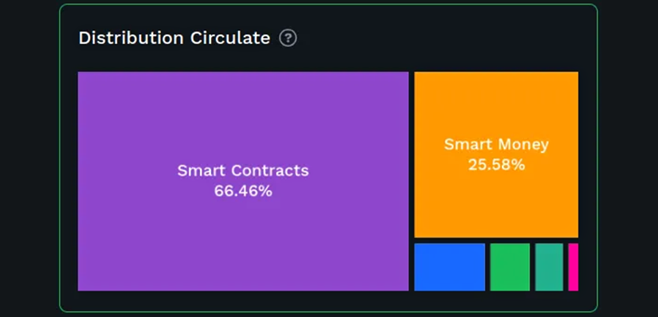
Distribution Circulate
This widget displays the distribution of circulating tokens, showing how much of the supply is held by the public and circulating in the market.
DEX Traders & Profit
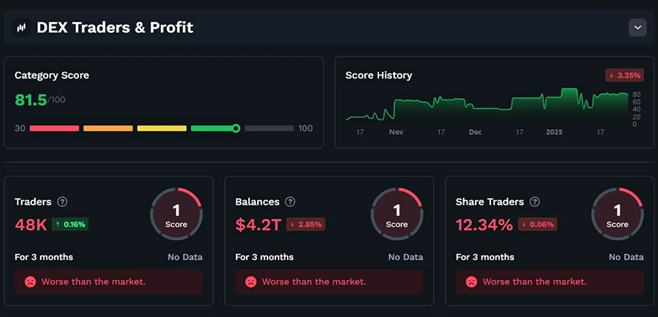
We monitor the activity of decentralized exchange (DEX) traders who interact with the asset, calculating both the number of trades and the profitability of these traders. Profitability is calculated using on-chain transaction data, measuring the difference between buy and sell prices across different trades.
Traders Definition
"Traders" are addressed with a positive balance of tokens, where the balance is less than $500,000.
To be categorized as a trader, the address must have had a zero balance at least once in the last month. This means traders often empty their wallets during transactions, qualifying them for this category.
Activity Widgets
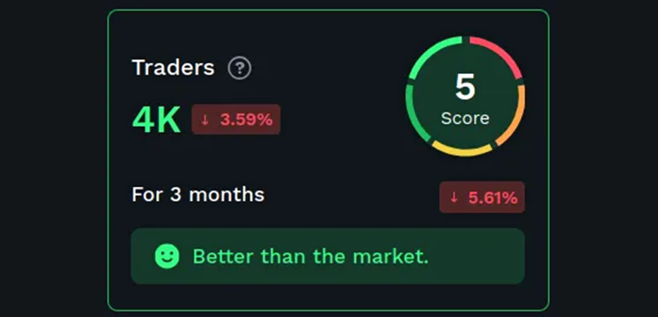
Traders
This widget shows the number of users buying or selling tokens. It tracks:
- The number of trader addresses holding tokens.
- Percentage changes in this number over the past 24 hours and the last 3 months.
- and its performance compares to other tokens.
Balances
Displays the total balance held by trader wallets at the current time. It also shows:
- The percentage change in this balance over the past 24 hours and the last 3 months.
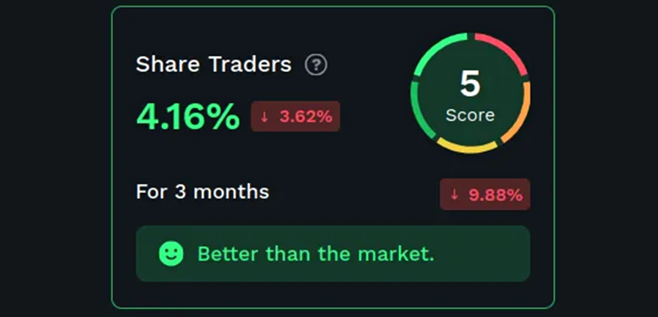
Share_Of_Trades
This widget shows the proportion of trader wallets among all token holders at the current moment. It also provides:
- The percentage change in this share over the past 24 hours and the last 3 months.
PNL (Profit and Loss)
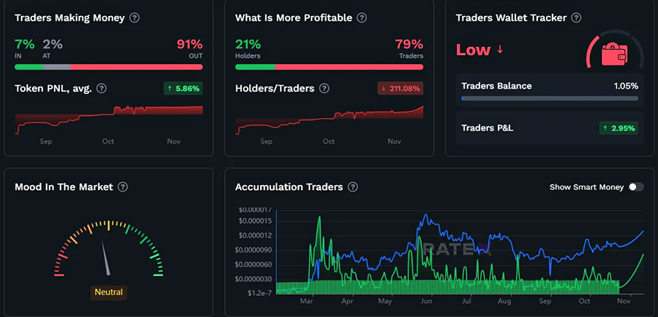
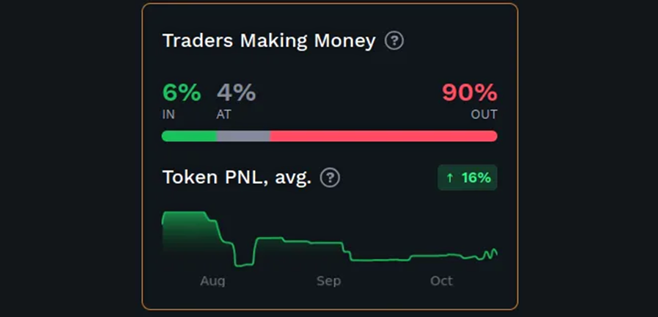
Traders Making Money
Similar to the "Holders Making Money" widget, this widget categorizes traders based on their profitability over the last three months:
- In Money: Traders who are in profit (green).
- At Money: Traders who are breaking even (gray).
- Out of Money: Traders who are in loss (red).
The widget calculates the PNL for both open and closed (liquidated) positions of traders. It uses the percentage price change between their buy and sell points to determine their profit or loss and categorizes their positions accordingly.
Comparison of Strategies
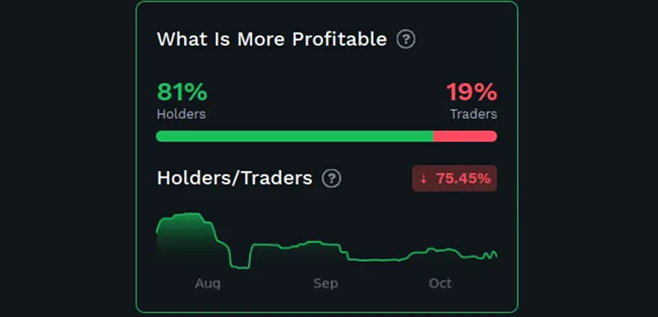
What Is More Profitable
This widget compares the profitability of holders and traders over the past three months.
It answers the question:
Which strategy — holding or actively trading — is more profitable?
- Holders: Addresses that hold tokens for longer periods.
- Traders: Addresses that engage in frequent trading.
Widgets Tracker
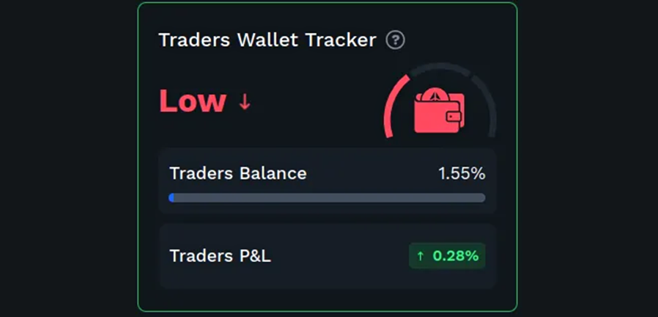
Traders Wallet Tracker
This widget tracks the wallets of traders and displays:
- Trader Balances: The proportion of total balances held by traders among all token holders, classified as:
Low (< 30%) Medium (30% < Medium < 60%) High (> 60%)
- Traders P&L: The weighted average PNL of trader addresses, calculated similarly to the "P&L Average" widget but focused specifically on trader wallets.
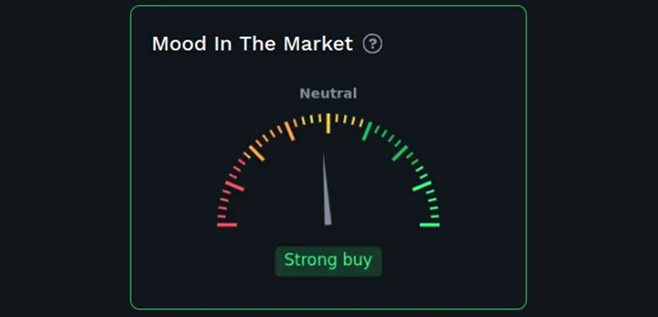
Traders_Mood In The Market
This widget tracks the buying and selling activity of traders and shows the percentage of purchases versus sales of the token.
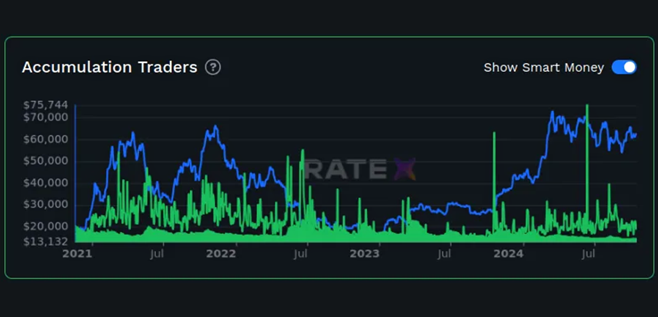
Accumulation Traders
This widget tracks the balances of traders who are in profit. It displays the historical balance data for trader wallets, along with the token’s price at those points in time.
Smart Money
The Smart Money score tracks the involvement of wallets or entities that are considered "smart" investors, typically large holders (overor early investors with a proven track record of profitable trading.
This score identifies patterns in their transactions to assess whether they are accumulating or distributing a given asset.
Smart Money Definition
"Smart Money" refers to addresses with balances exceeding $500,000 in a given token.
These addresses are considered high-value holders and may provide insights into market movements.
Activity Widgets
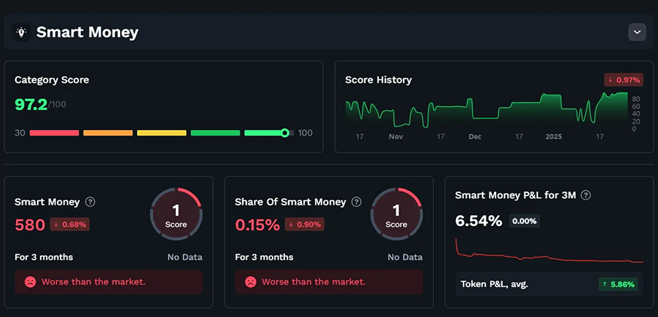
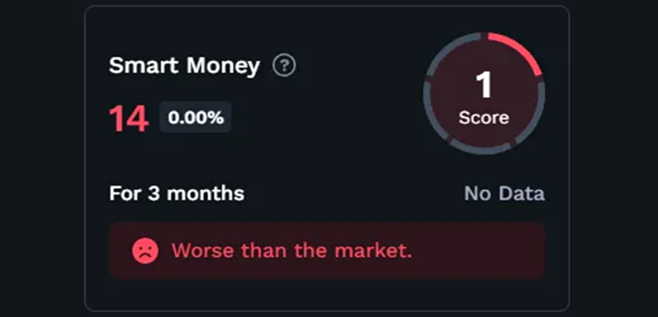
Smart Money
This widget tracks the number of Smart Money wallets, showing how many addresses hold more than $500,000 worth of the token being viewed. It provides:
- The current number of Smart Money wallets.
- Changes in this number over the past 24 hours and the last 3 months.
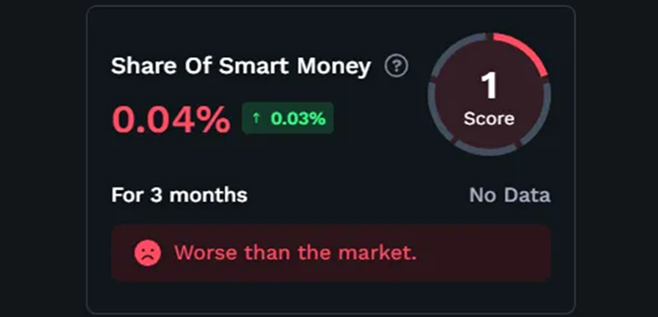
Share Of Smart Money
This widget displays the proportion of Smart Money addresses relative to all token holders. It also shows:
- Percentage changes in this share over the past 24 hours and the last 3 months.
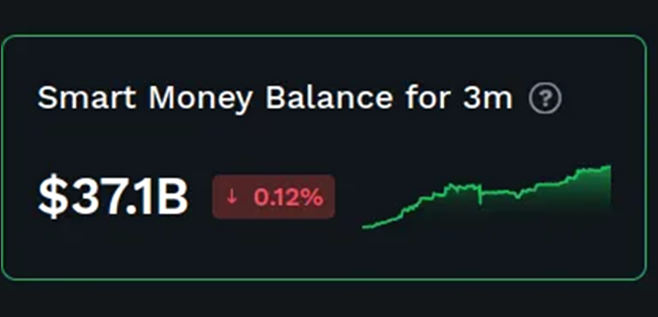
Smart Money Balance for 3 Months
Tracks the total balance held by Smart Money wallets over the last 3 months, displaying:
- A graph showing how the total balance of Smart Money wallets has changed. This can indicate whether high-value holders are accumulating or reducing their positions.
PNL (Profit and Loss)
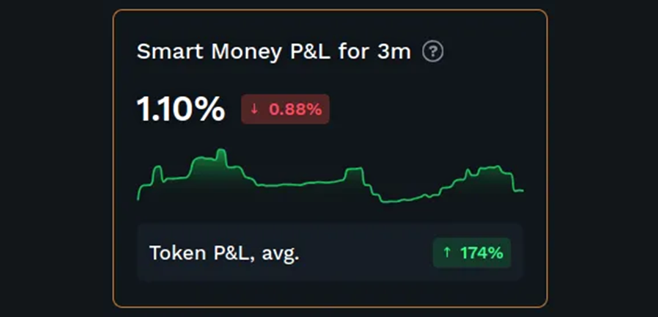
Smart Money P&L for 3m
This widget calculates the weighted average PNL (Profit and Loss) for Smart Money wallets, based on their closed positions over the past 3 months. It includes:
-
The current PNL value and changes over the past 3 months.
-
The calculation involves tracking Smart Money addresses (with balances over $500,000) and computing the PNL based on their buy and sell transactions. The weighted average is then derived from the PNL of each closed position.
A graph illustrates the profit/loss of Smart Money over the past 3 months based on liquidated positions.
The widget also compares the Smart Money PNL with the Token P&L Average, which includes PNL for all types of addresses.
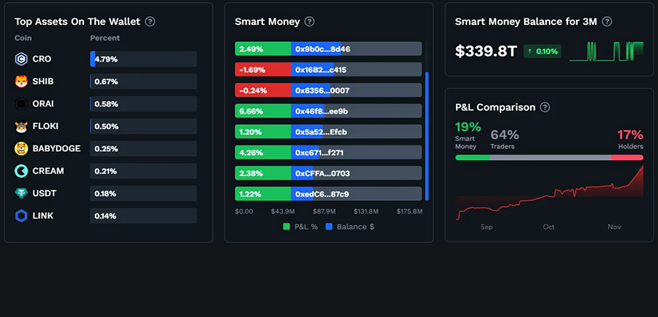
Comparison of Strategies
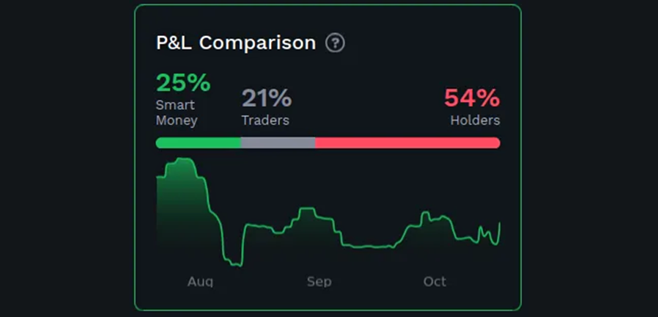
P&L Comparison
This widget compares the profitability of different strategies over the past 3 months, showing which one is the most profitable and what percentage of the maximum potential PNL each strategy achieves on a given day. The maximum PNL is the theoretical maximum that could be earned if all address types were profitable that day.
The strategies compared are:
- Smart Money: Holding tokens on wallets with balances exceeding $500,000.
- Holders: Holding tokens for 3 months on wallets with balances less than $500,000.
- Traders: Active trading, with wallets that periodically have zero balances.
Widgets Tracker
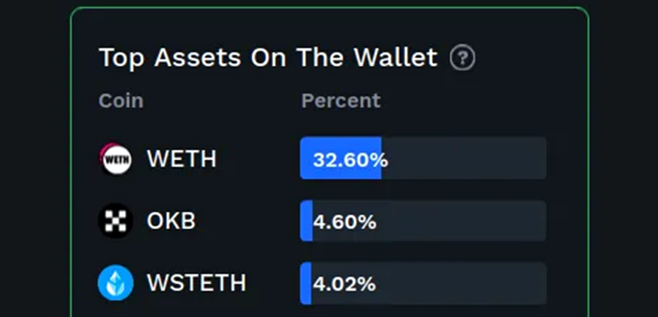
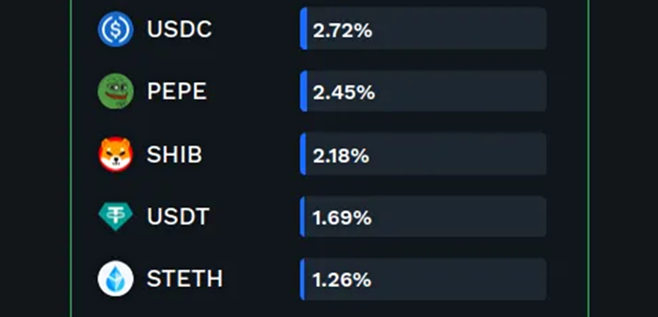
Top Assets On The Wallet
This widget shows which other tokens are held by Smart Money wallets (those with balances over $500,000), aside from the token displayed on the current page.
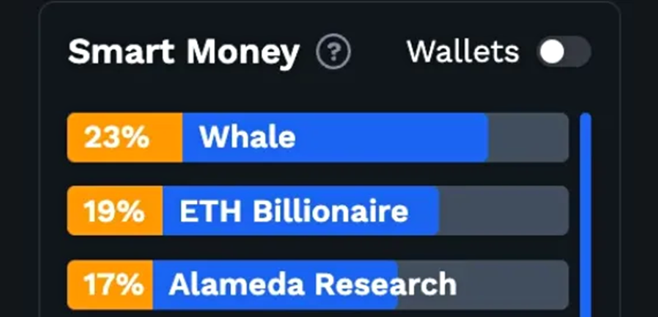
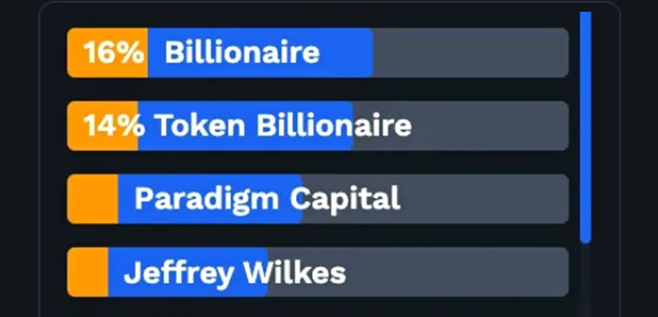
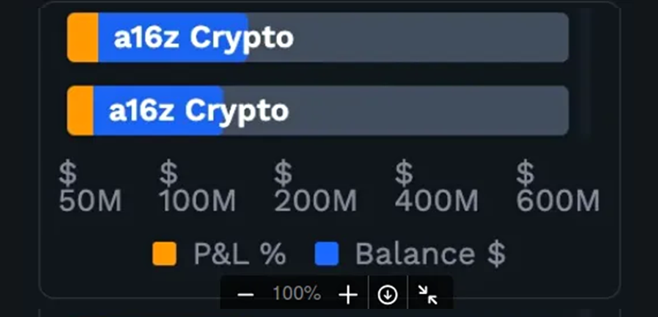
Smart Money Wallets
This widget lists the top 10 Smart Money addresses based on their balances, showing:
- Their token balances.
- Their PNL over the last 3 months in dollars.
- The percentage of their current balance that comes from profit or loss.
PNL in this context refers to the profit or loss of the address over the past 3 months, and it shows how much of their current balance is due to gains or losses.
The score formula is calculated as below:
(Holders Score + DEX Traders & Profit Score + Smart Money Score) / 3
The score is grouped into rating tiers:
AAA (≥88), AA (≥77), A (≥66), BBB (≥55), BB (≥44), B (≥33), CCC (>22), CC (>11) and C (>1).
This score helps assess the strength of the token in each category.
Additional Information related to the token/project is also available for better evaluation of token performance and future.
Emission
The emission score reflects how quickly new tokens or coins are created. It’s calculated by looking at the tokenomics of the asset, including how new tokens are issued, the supply schedule, and the inflation rate.
This score gives insights into the supply-side pressure of a cryptocurrency — essentially, how the supply of tokens is growing.
Activity Widgets
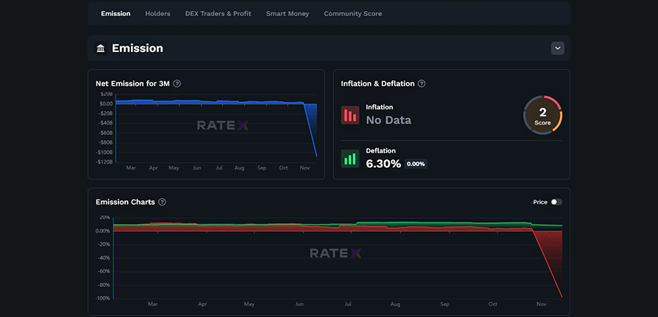
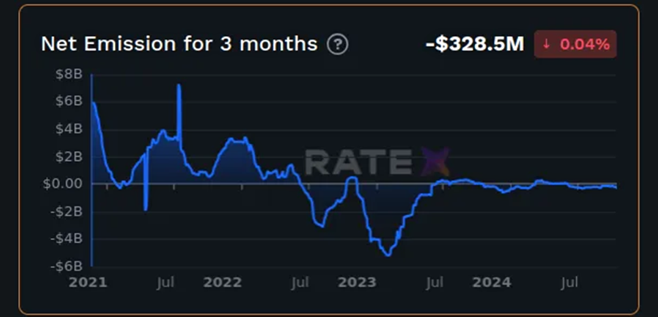
Net Emission for 3 months
Net Emission is an indicator of the change in the total money supply. Emission refers to the net increase or decrease in the supply of money or tokens over a certain period. It is important for understanding inflationary or deflationary pressure on a specific token. Emission can be calculated by comparing the total number of tokens at different points in time. This calculation helps determine whether a cryptocurrency is inflationary (increase in supply) or deflationary (decrease in supply).
You can calculate Net Emission by comparing the total number of tokens at two different points in time. This helps determine if the cryptocurrency’s supply is growing (inflationary) or shrinking (deflationary).
For the Net Emission widget, we calculate it by taking the difference between the tokens that were created and those that were removed over a given time period — here, we're using a 3-month window. The formula to calculate Net Emission is:
Net Emission = (Current Supply − Previous Supply)
where:
- Previous Supply – The total token supply from 3 months ago
- Current Supply – The total token supply right now
In this calculation, we use the circulating supply — this refers to the total balance held in active wallets over the past 6 months. An active wallet is one that has made at least one transaction (buy or sell) during this period.
The percentage change is calculated by comparing the current Net Emission to the Net Emission from 3 months ago. This shows how much the supply has changed over the last quarter.
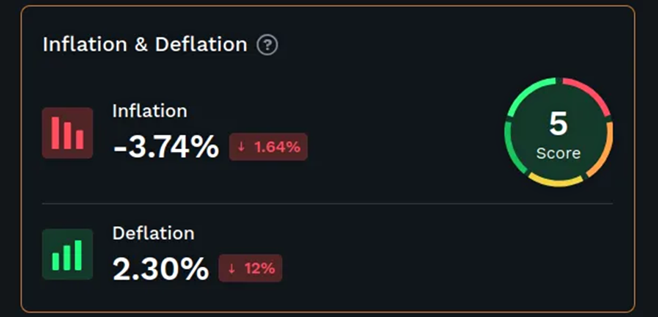
Inflation & Deflation
Inflation is calculated based on Net Emission. If the Net Emission value is positive and significant, it indicates inflationary pressure, as an increase in the money supply can lead to a rise in prices. The formula for calculating inflation is:
Inflation = ((Current Supply − Previous Supply) / Previous Supply) × 100%
Where:
- Previous Supply – The total supply of tokens 3 months ago
- Current Supply – The current supply of tokens at the present moment
Deflation here is calculated by focusing on the addresses that are part of the circulating supply. This includes wallets that have made at least one purchase or sale in the past 6 months.
We aim to measure the deflationary pressure at a given moment, so the deflation widget is based on the idea of tokens being "locked" in wallets. Specifically, we calculate how many tokens were purchased but have remained in the same wallet without being transferred for more than 3 months — meaning these tokens are effectively out of circulation, removed from the active market.
To calculate this, we focus on wallets that are part of the circulating supply and identify those that haven’t made any transaction for more than 3 months. These wallets initially bought tokens within the first 3 months of the 6-month period (which defines the circulating supply) but haven’t transferred them since. This gives us the deflation value within the current circulating supply.
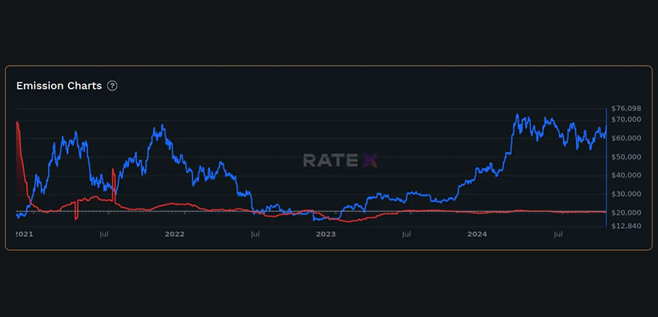
Emission Charts
This chart shows the relationship between inflation and the token price over time.
Community Score
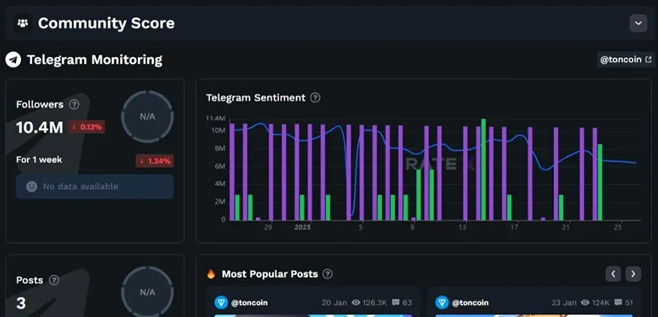
The Community Score is calculated based on social media activity, engagement levels on popular platforms (like X, Telegram), and participation in forums. This metric gauges the strength and growth of the asset’s community.
Telegram Monitoring
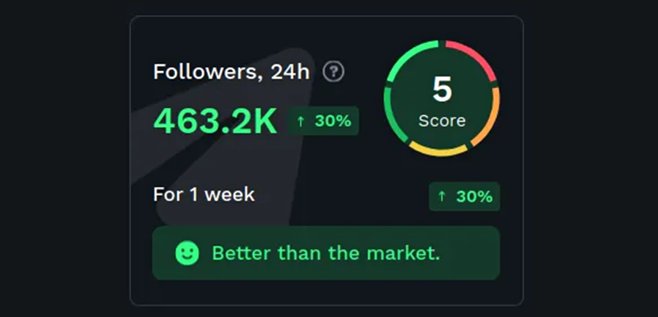
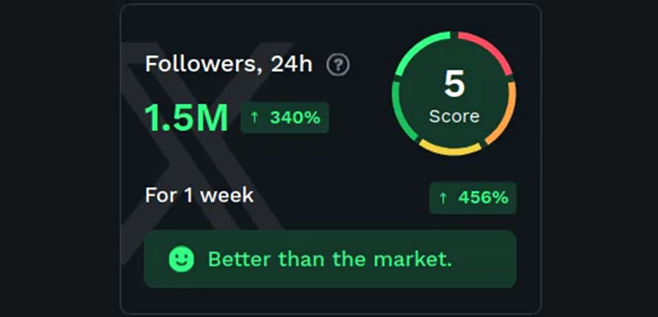
Followers, 24h
This widget tracks the total number of subscribers across Telegram channels related to the specified token at the current moment. It provides:
- The total current number of followers.
- The percentage change in the number of followers over the last 24 hours.
- The percentage change in followers over the past week.
- and also its performance compares to the other tokens.
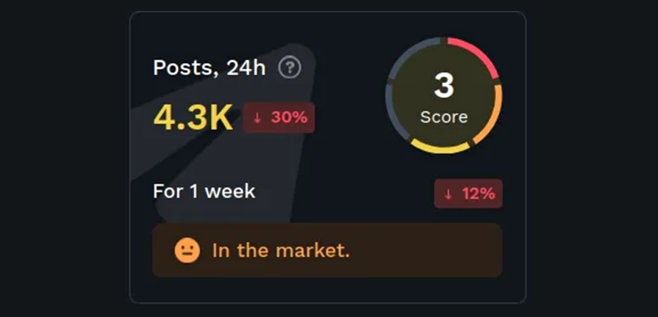
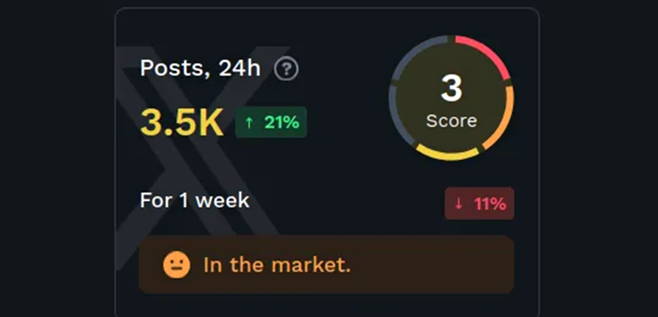
Posts, 24h
Tracks the total number of posts in Telegram channels dedicated to the specified token. It provides:
- The current number of posts.
- The percentage change in post count over the last 24 hours.
- The percentage change in posts over the last week.
- and also its performance compares to the other tokens.
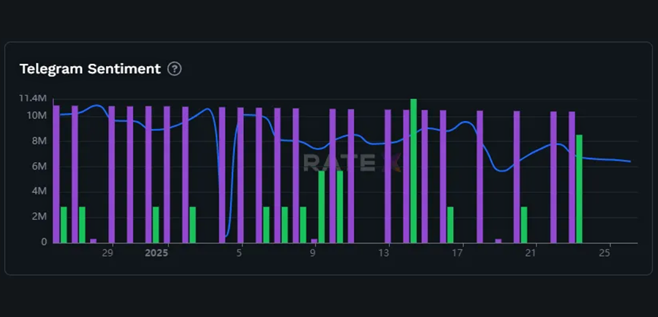
Telegram Sentiment
This widget tracks the correlation between Telegram messages, group member growth, and the token’s price over the past month. It visually represents:
- The relationship between sentiment expressed in Telegram messages and the price of the token.
- How group member counts and message frequency respond to price fluctuations.
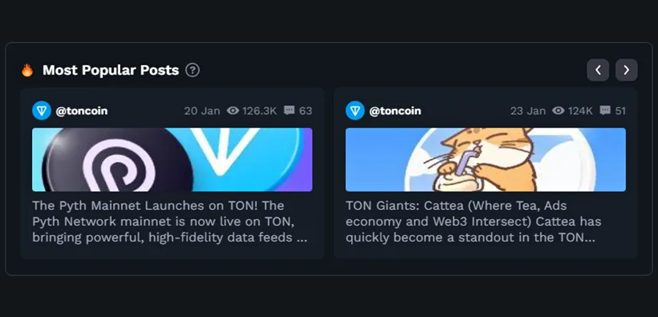
Most Popular Posts
This widget highlights the most popular posts related to the token on Telegram, ranked by:
- The number of engagements (replies, forwards, reactions).
- Relevance to the token's community discussions.
This provides insights into the top discussions and trending content around the token within Telegram groups.
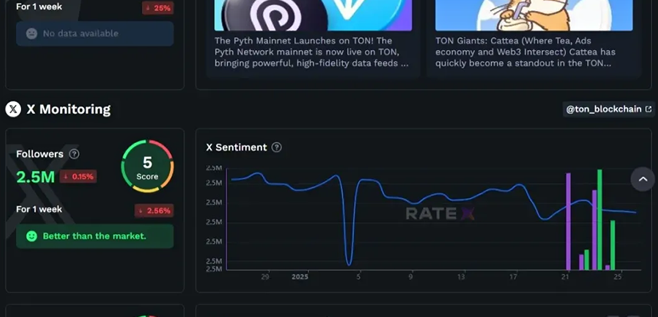
X (formerly Twitter) Monitoring
Followers, 24h
This widget tracks the total number of followers from X (Twitter) accounts related to the specified token at the current moment. It provides:
- The current number of followers.
- The percentage change in followers over the last 24 hours.
- The percentage change in followers over the past week.
- and also its performance compares to the other tokens.
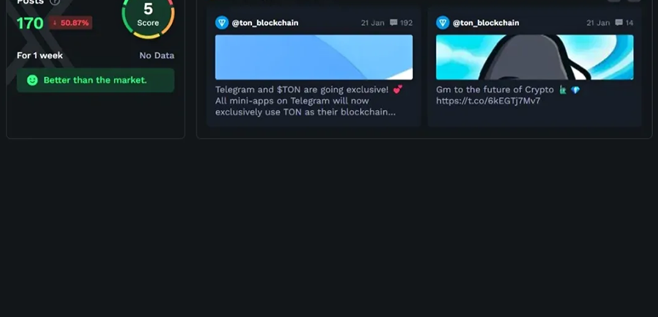
Posts, 24h
Tracks the total number of posts in X (Twitter) accounts that mention or focus on the specified token. It provides:
- The current number of posts.
- The percentage change in posts over the last 24 hours.
- The percentage change in posts over the last week.
- and also its performance compares to the other tokens.
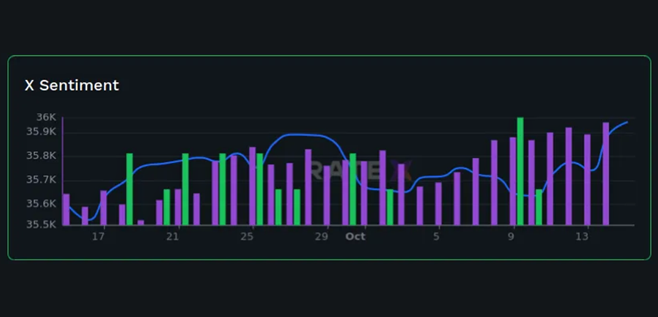
X Sentiment
This widget tracks the correlation between X (Twitter) posts, follower growth, and the token’s price over the past month. It visually represents:
- The relationship between sentiment expressed in X posts and the price of the token.
- How follower counts and post frequency respond to price fluctuations.
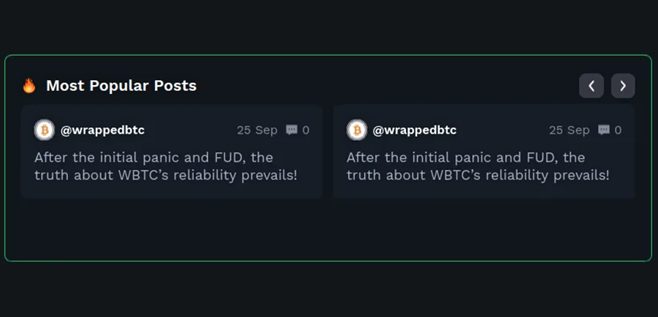
Most Popular Posts
This widget highlights the most popular posts related to the token on X (Twitter), ranked by:
- The number of engagements (likes, retweets, comments).
- Relevance to the token's community discussions.
This gives insights into the top discussions and trending content around the token on social media.
Conclusion
By leveraging a data-driven approach and rigorous validation processes, RateX Score provides a clear and reliable assessment of crypto assets. As the market evolves, we continue refining our methodology to ensure accurate, transparent, and insightful ratings for investors and analysts alike.
Read More

The Art of Crypto Token Analysis: Vital Input Attributes Explained
The ability to effectively analyze and evaluate crypto tokens is crucial for making well-informed decisions and maximizing potential returns.
RateX Foundation
06 Jun 2024

Crypto Analytics Tools: Enhancing Trading and Investment with Data-Driven Insights
The ability to analyze vast amounts of data effectively can make the difference between success and missed opportunities.
RateX Foundation
28 Aug 2024

The Importance of Staying Up-to-Date with Crypto News and Events
Staying informed about the latest news, events, and trends within the crypto ecosystem is of paramount importance for investors, enthusiasts and professionals.
RateX Foundation
14 May 2024

