Get RateX Pro
Published 11 Mar 2025

How Data and AI Help Predict Pumps and Market Movements
Big Data in Crypto: Analyzing Billions of Messages and Transactions
At RateXAI, we have been actively collecting and analyzing data from X (Twitter) and Telegram for over a year. To date, we have accumulated over 3 billion messages, along with billions of transactions and more than 200 million OnChain wallets. Using machine learning and sentiment analysis, we test hypotheses that can identify patterns in the market.
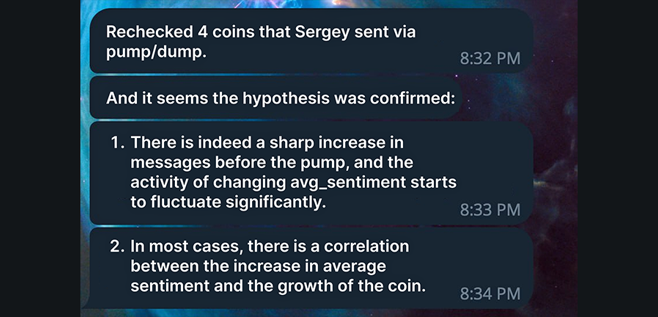
Recently, we tested one of our hypotheses on four tokens provided for pump/dump analysis, and the results were quite interesting:
- Before a pump, there is a sharp increase in the number of social media messages.
- The average sentiment (avg_sentiment) starts fluctuating abnormally.
- In most cases, there is a correlation between sentiment growth and token price increases.
These insights allow us to develop algorithms for early detection of potential pumps and sharp market movements.
Data Visualization: Analyzing the Influence of Key Figures
To provide concrete evidence, let’s look at some of our AI-driven network graphs.
Case 1: Elon Musk
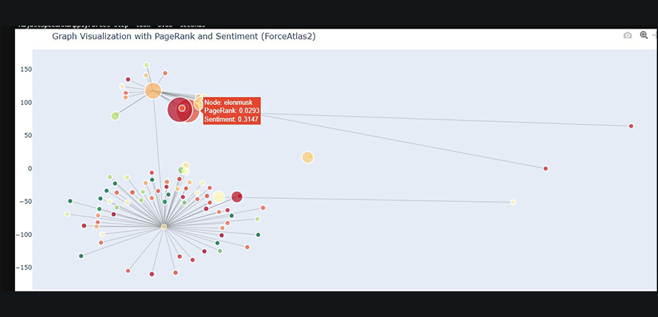
- Node: elonmusk
- PageRank: 0.0293
- Sentiment: 0.3147
This graph illustrates how messages related to Elon Musk are distributed among market participants. Soon, similar sentiment maps will be available for every token, helping traders evaluate how bullish a community is around a specific project.
Case 2: Sergey Nazarov (ChainLink)
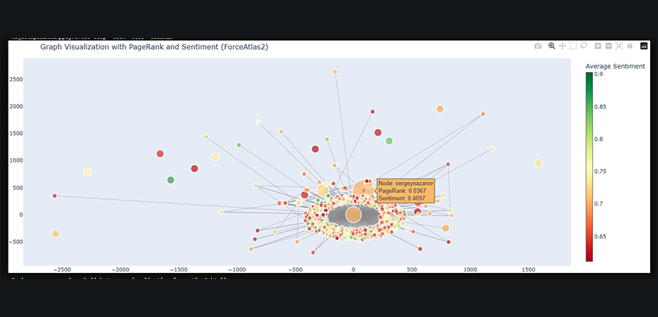
- Node: sergeynazarov
- PageRank: 0.0367
- Sentiment: 0.4097
This graph showcases different discussion groups surrounding Sergey Nazarov, CEO of ChainLink:
- Red – Haters.
- Yellow – Neutral participants, slightly leaning positive.
- Green – Bullish investors.
Such analysis helps to better understand the audience and the influence of key opinion leaders on the market.
Trend Analysis: Sentiment, Transactions, and Price
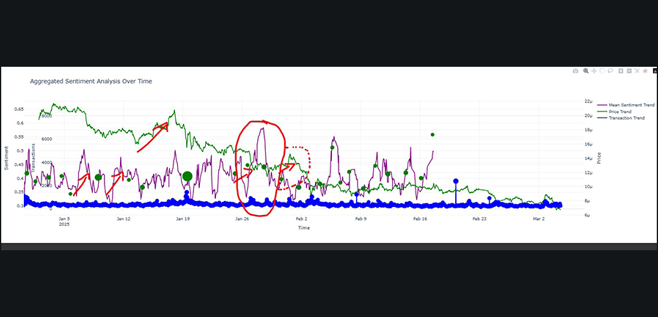
We also conducted an in-depth study of PEPE and Uniswap. Our data analysis revealed that before a price increase, two key events typically occur:
- A surge in OnChain transactions for the token (blue line).
- A sharp spike in sentiment across social media (purple line).
These factors often precede a subsequent rise in token price (green line).
These patterns confirm that Big Data analysis and AI tools can play a crucial role in predicting market trends.
What’s Next?
In the near future, our platform will offer automated analytics for every token, allowing users to assess its potential based on sentiment and OnChain activity. Stay tuned for updates!
RateXAI is making trading smarter.
Read More

 06 Jun 2024