
 Get RateX Pro
Published 05 Mar 2025

How RateXAI Calculates On-Chain Rank (Web3 Explorer)

At RateXAI, we deliver real-time updates on a broad spectrum of cryptocurrency market data. Every minute, our system queries multiple exchanges via APIs to gather the freshest insights available. This data is then processed by our sophisticated algorithms, which ensure its accuracy and integrity through extensive cleaning and verification procedures. We provide a wide array of carefully validated metrics across various crypto assets, giving you a comprehensive and trustworthy view of the market. Please read the article below to understand how we calculate and evaluate the On-Chain Rank (Web3 Explorer) metric on RateX.
On-Chain Rank (Web3 Explorer)
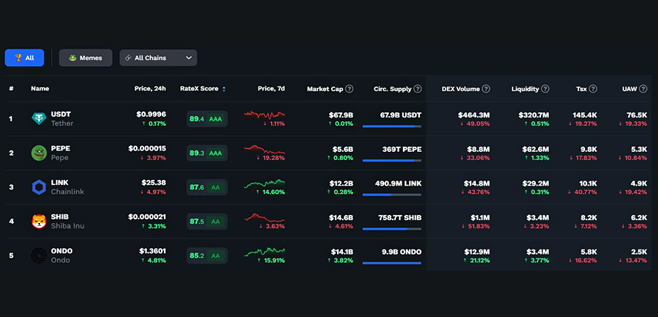
Our On-Chain Rank evaluates and ranks individual crypto assets based primarily on liquidity, while additional key metrics are displayed for further insights into their on-chain performance, activity, and adoption.
Individual Crypto assets are also ranked by Liquidity, with other performance indicators provided as supplementary information. The following metrics are evaluated:
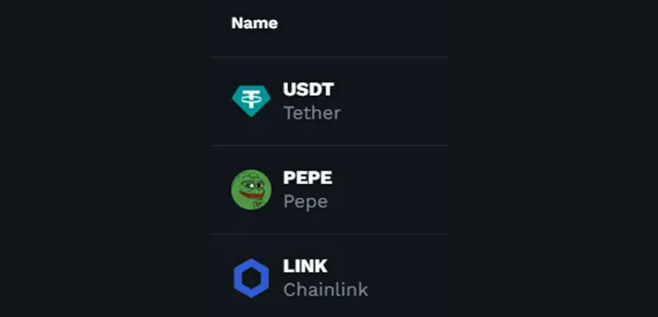
- Token Name: The specific name of the cryptocurrency being ranked.
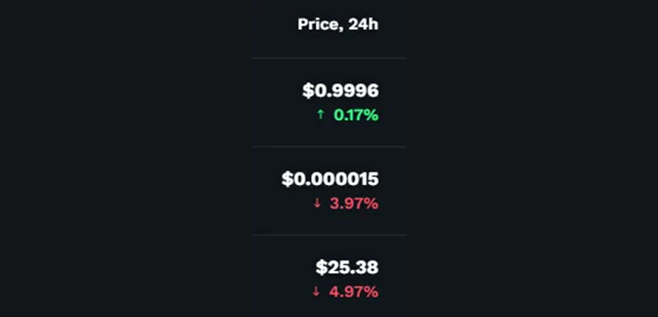
- Price (24h & 7d): The price performance of the asset over the last 24 hours and 7 days, providing insight into short-term volatility and trends.
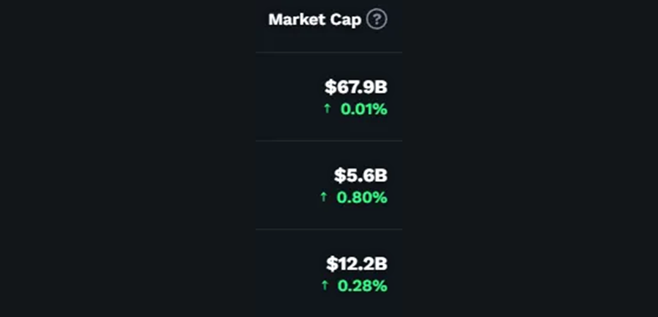
- Market Cap: The total market capitalization, calculated by multiplying the current price by the circulating supply. This metric reflects the asset's total valuation in the market.
Market cap = current price * circulating supply
- Circulating Supply: The number of tokens currently available and being actively traded in the market.
Circulating supply = Total supply - locked coins that cannot influence the supply of the coin on the market
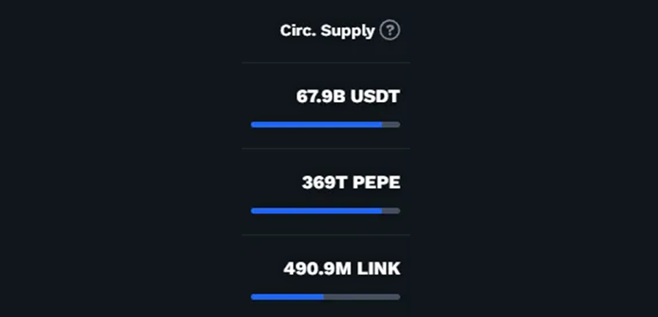
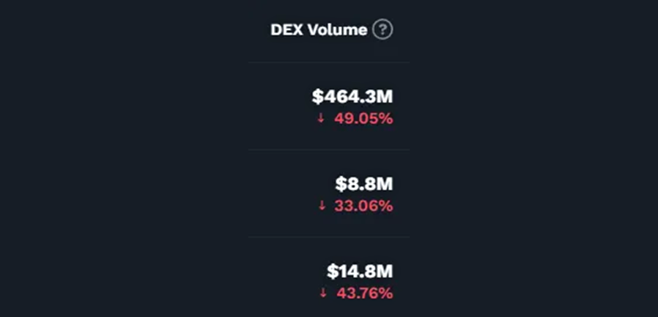
- DEX Volume: The total trading volume of the asset on decentralized exchanges over a specific period, indicating its popularity in DeFi markets.
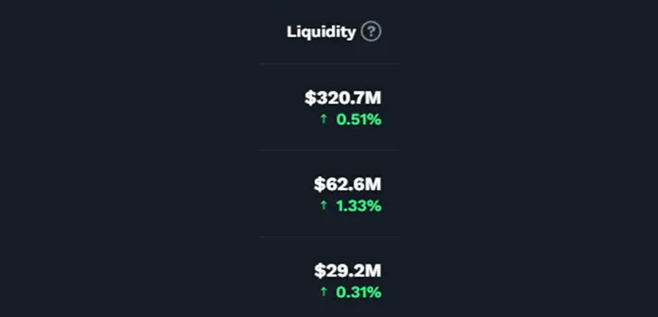
- Liquidity: The amount of liquidity available for the asset across various decentralized exchanges, impacting the ease of trading and price stability. This is the primary ranking factor for Crypto assets.
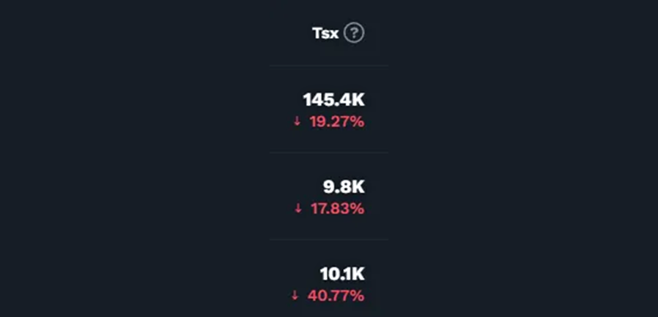
- Transactions (Tsx): The total number of on-chain transactions over a specific period (3 months in our case), providing insight into the asset’s usage and network activity.
- Unique Active Wallets (UAW): The number of unique wallet addresses interacting with the asset, reflecting its level of adoption and user engagement.
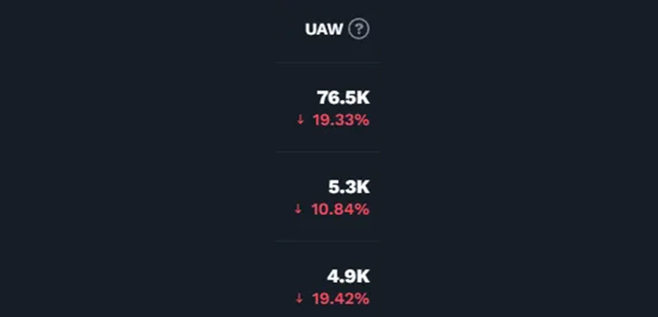
While Liquidity is the driving factor for ranking, other metrics such as market cap, transaction volume, and active wallet counts are shown to provide additional context on the asset’s performance and adoption.
Conclusion
By leveraging cutting-edge algorithms and rigorous validation processes, RateXAI ensures that every metric, including the On-Chain Rank (Web3 Explorer), provides accurate and reliable insights for the crypto community. Stay ahead of the market with our continually updated data and trusted metrics.

Read More

 06 Jun 2024